Introduction
Well, there are many reasons why it happens. Here you will learn some useful tips for running your own testing process.
You may wonder why it matters to you. Well, it is more important than you think. It will give you an approximate of your site’s health, therefore, you will be able to take actions to make it better. So let’s start…
Table of contents
First, let’s define some concepts you need to relate with:
- PageSpeed score: Developed by Google, It gives you recommendations to make your site faster and more mobile-friendly based on the implementation of best web practices.
- YSlow score: With the same purpose of making your site faster, it runs 34 rules divided into 6 categories. Based on that, it suggests actions that will increase your web performance.
- Fully loaded time: It represents the average of seconds your site takes to show the full page.
- Total page size: It represents the amount of space needed to load the page in Mb.
- Requests: These are some kind of questions your site make to it own local storage and services, as well as those it makes to third services.
How do I analyze my site?
So once you decide to know what’s going on with your site, you may go crazy when getting the needed information. Well, that’s not necessary because there are some tools to do it.
We’ve chosen the Youtube page to test it and the different tools mentioned below…
GTmetrix
Is a helpful tool that gives you a compound of results based on metrics including PageSpeed and Yslow, it also recommends actions to your site.
This is the scanner results for Youtube
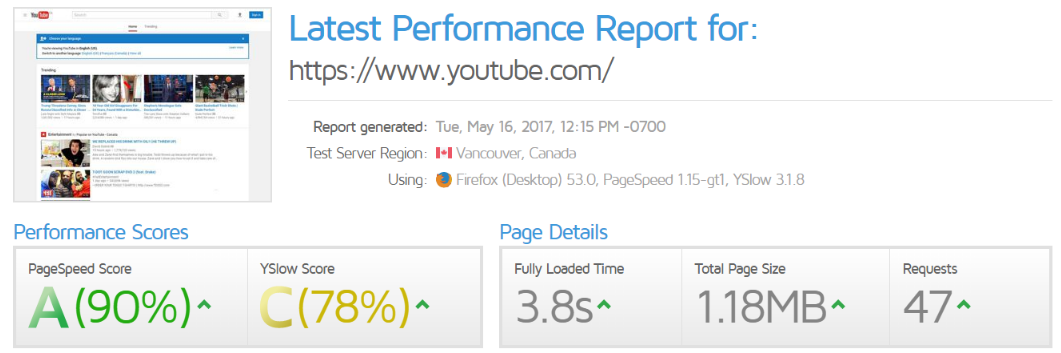
As you see, it gives you a quick glance of the page performance, so you can easily visualize important information about it.
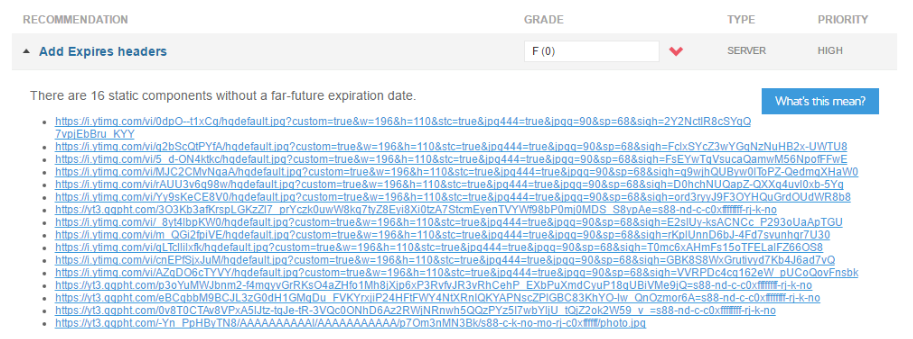
If you want to know more specific data, down below you’ll see a list of things that GTmetrix recommend to be changed or optimized. This is a top list prioritized by impact:

And if you click at once action you’ll see some recommendations. Also at the top, there’s the grade score from F to A, type and priority.
If you want a more specific report you can sign up to GTmetrix to add extra metrics, and if you want to do a test we recommend you to visit: https://gtmetrix.com/
As we said, PageSpeed is developed by Google and it displays a quick informative window divided in two:
- Mobile. It shows an average based on 100 and a list of those who need attention.
- Desktop. In the same way, it shows the average based on 100 and the list of things that need attention.
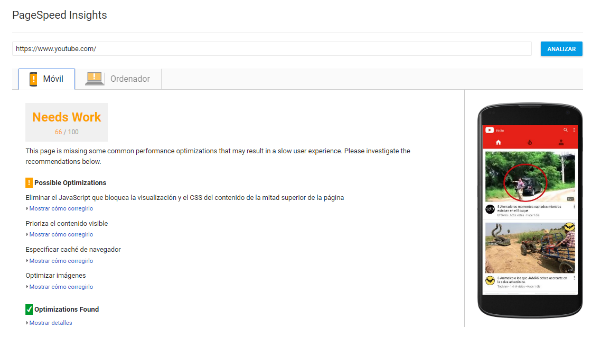
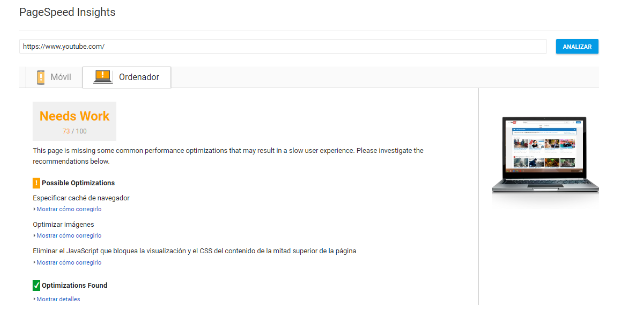
Here you will see some differences in the score between desktop and mobile, this is because there are specific things for each one and the impact is in different ways. There are also some recommendations you might follow.
If you want to know more about PageSpeed, we invite you to visit their site: https://developers.google.com/speed/pagespeed/
Pingdom
As well as the mentioned before, but with the peculiarity that this tool gives you one extra metric “Faster than” it displays a percentage based on 100% that says your site is faster than X% of tested pages.
At the Pingdom page, you will see all the pricing options according to your needs. For this blog, we will only use the free tool located at the left bottom of the page. Here is a difference with the tools mentioned before, and it is the ability to change the location from where you want to test the page.
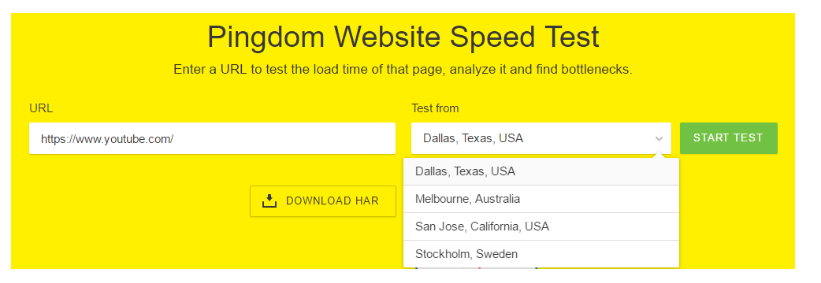
Now that you have chosen, the location can proceed to analyze the site.
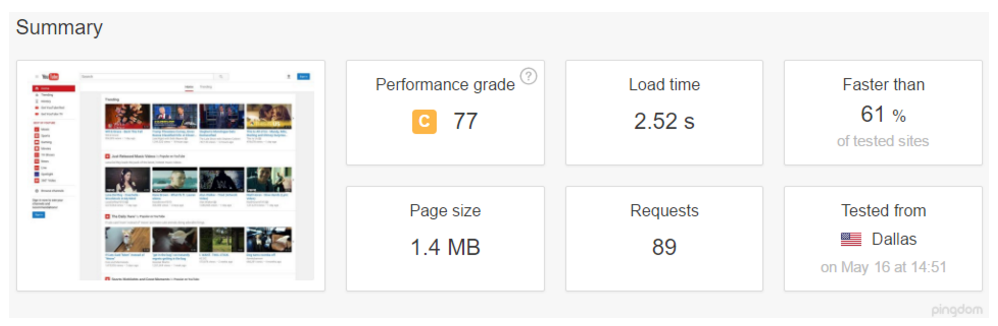
Summary: Here is the quick glance to the page health, that list the metrics mentioned before in the beginning of this blog.
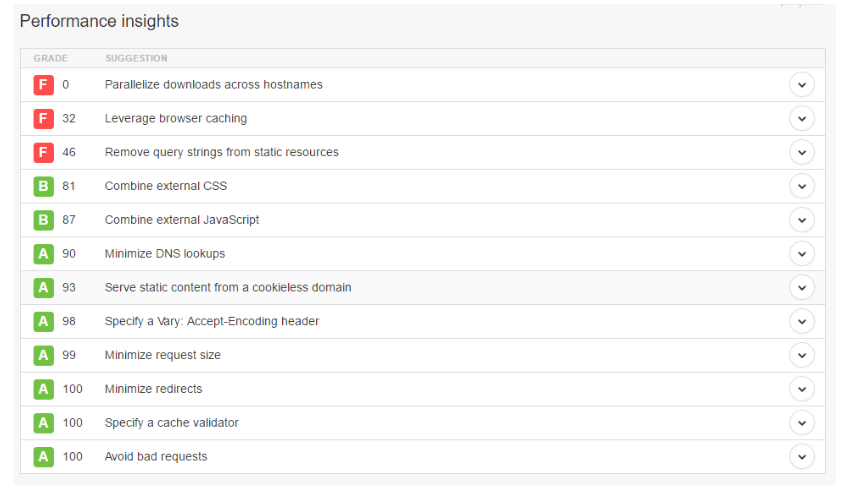
Same way, prioritized by a score from F to A, Pingdom shows a list of things that need attention.
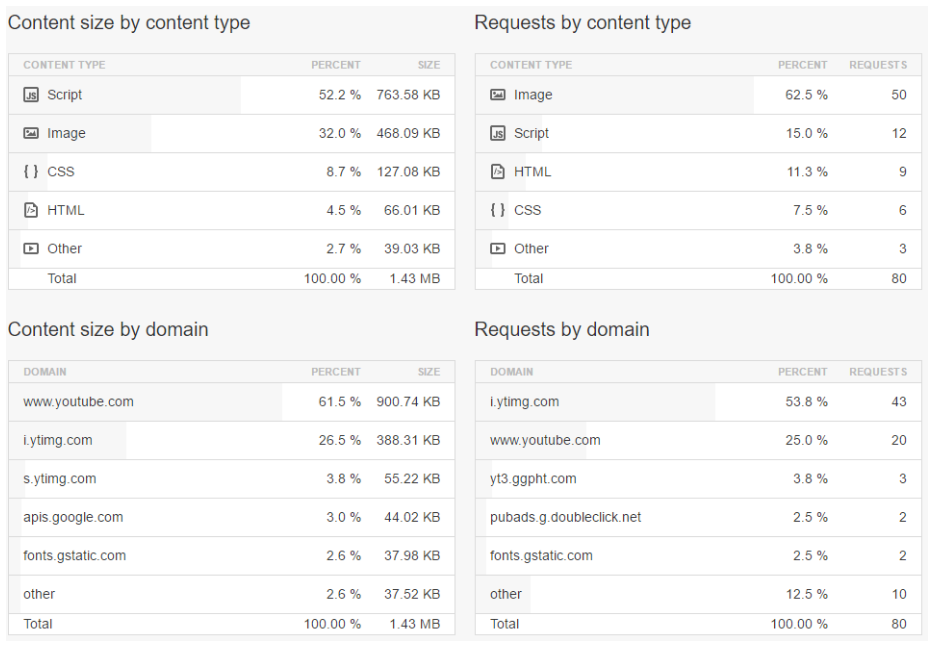
Down below you will see 4 tables
Content size by Domain
Content size by Type
Request by Domain
Request by Type
These sectioned tables show you a list of data based on percentages, so you can easily see how many space your site need and how many “Request” your site makes.
Conclusion
Now that you know how to do a quick review of your site’s performance, the question would be… Is it faster enough?
We know the importance that implies having a good site. We have a team ready for you able to provide good performance without compromising the page security, so… What are you waiting for?Your website will always be one of your priorities, that’s why I truly recommend you to check out its performance. You are in the correct time to stop having a slow website performance by speeding up your site and start enjoying lots of traffic and clients.Check out these links if you want to learn more about How to monitor Your Application Health & Performance or about The 8 useful tricks to speed up your WordPress site.