Engineering productivity metrics are hard to measure because software development is a creative, collaborative, and non-linear process. It relies on problem-solving, context, and teamwork rather than on quantifiable outputs such as lines of code, pull requests, or closed story points.
Some of my most productive days involved refactoring troublesome logic and reducing lines of code, which led to fewer bugs and a more maintainable system.
If my productivity had been measured by code volume alone, that work would have gone completely unnoticed. The same principle applies at the team level: two engineers can ship identical amounts of code with entirely different business outcomes. One writes a 200-line fix that reduces checkout abandonment by 12%; the other spends the same week building a feature that customers never adopt.
Now that AI can generate code, tests, and documentation in seconds, traditional engineering productivity metrics simply no longer work.
As a CTO, Project Manager, or Engineering VP, your goal is not to measure how much activity your engineers produce. Instead, measure how effectively your organization turns engineering time, talent, and tools into customer and business value.
Blog Overview
- Engineering productivity should be measured by outcomes, not by activity metrics such as lines of code, commits, or tickets closed.
- Start with DORA metrics to understand delivery speed, reliability, and operational performance.
- Track process metrics such as Cycle Time, Pull Request Review Time, Work in Progress (WIP), and Blocked Time to uncover bottlenecks.
- Measure teams and value streams rather than individual developers to encourage collaboration and shared ownership.
- AI is increasing coding speed, making quality, validation, code review, and system design more important productivity constraints.
- Balance speed with quality by monitoring Change Failure Rate (CFR), Mean Time to Recovery (MTTR), and developer experience.
- No single metric measures engineering productivity. High-performing organizations combine delivery, quality, business, and developer experience metrics to create a complete picture.
- Connect engineering performance to business outcomes through metrics like Revenue per Engineer and customer impact.

Engineering Productivity Metrics Summary
| Metric | What It Measures | Why It Matters | Benchmark / Target | Common Tools |
|---|---|---|---|---|
| Deployment Frequency | How often does code reach production | Measures delivery speed and release maturity | Elite: Multiple deployments/day | GitHub Actions, GitLab, Jenkins, CircleCI, LinearB |
| Lead Time for Changes | Time from commit to production | Identifies bottlenecks in the delivery pipeline | Elite: < 1 hour | LinearB, Swarmia, Hatica, Jellyfish |
| Change Failure Rate (CFR) | % of deployments causing incidents | Evaluates software quality and release reliability | Elite: 0–5% | PagerDuty, Datadog, New Relic, Grafana |
| Mean Time to Recovery (MTTR) | Time to restore service after failures | Measures incident response effectiveness | Elite: < 1 hour | PagerDuty, OpsGenie, FireHydrant, Datadog |
| Cycle Time | Time from work start to production | Reveals workflow efficiency | Lower is better | GitHub Analytics, GitLab, LinearB |
| PR Review Time | Time until first code review | Highlights collaboration and review bottlenecks | Faster reviews improve flow | GitHub, GitLab, Swarmia |
| Work in Progress (WIP) | Number of active unfinished tasks | Reduces context switching and delivery delays | ≤ 3 active items per engineer | Jira, Linear, Azure DevOps |
| Blocked Time | Time work remains stalled | Exposes organizational friction and dependencies | Minimize blocked hours | Jira, Linear, Swarmia |
| Feature vs Maintenance Ratio | Engineering allocation across innovation and maintenance | Balances growth with technical debt management | Typical: 60/20/20 | Jira, Linear, Asana |
| Revenue per Engineer (RpE) | Revenue generated per engineer | Connects engineering investment to business outcomes | Median: ~$892K | NetSuite, Workday, Power BI |
| Developer Experience (DevEx) | Engineer satisfaction and productivity | Improves retention and delivery performance | Continuous improvement | DX, Jellyfish, Pluralsight Flow |
What are The Biggest Mistakes When Measuring Engineering Productivity?
Measuring Individual Performance Instead of Team Performance
Modern engineering work depends on collaboration across developers, QA, product managers, designers, security teams, and platform teams.
The team is the irreducible unit of ownership, which means optimizing for individual output metrics pushes engineers toward maximizing their own visible contribution rather than what’s best for collective delivery.
That breeds:
- competition where collaboration should be
- information hoarding where knowledge sharing matters most,
- and a tendency to avoid unglamorous work that keeps systems healthy (remember my code refactoring story earlier).
Take this example: an engineer who spends three days diagnosing a recurring production incident may write very little code but save the business millions in downtime and lost customer trust.
Using Vanity Metrics
Many organizations still rely on metrics such as:
- Lines of code
- Commit count
- Pull request count
- Story points completed
- Hours logged
- Tickets closed
- Time spent coding
While these metrics have diagnostic value, they measure activity rather than impact, and they are easy to game. For example, if my team’s engineers know I’m tracking PR count, they can split a single feature into ten pull requests, dramatically increasing their PR count without creating any additional customer value.
In 2026, this is a particularly dangerous problem when measuring engineering productivity metrics.
Research from Microsoft, MIT, and Princeton across nearly 4,900 developers found that an AI coding assistant led to a 26% increase in completed tasks. If AI coding tools can generate large amounts of code almost instantly, output-based metrics are increasingly unreliable.
Sometimes, writing less code is a sign of better engineering because there’s less bloat.
More importantly, never use these metrics in isolation. Instead, balance them with outcome-oriented measures such as cycle time, deployment frequency, customer-facing releases, incident rates, and business KPIs. More on these metrics later.
Ignoring Bottlenecks
Factors outside a developer’s control usually delay engineering work.
Common bottlenecks include code review queues, approval chains, deployment gates, security review backlogs, dependency management, cross-team coordination, and environment provisioning delays.
Each of these can stall a team completely while their individual task counts keep climbing.
For example, if my team is completing 90% of their sprint work but spending 40% of their cycle time waiting for QA sign-off, they’ll have poor time-to-market metrics and bloated work-in-progress (WIP) states, but the root cause is a process failure on my part, not engineering-related.
When you focus only on output metrics, you’re missing the bottlenecks that slow the entire delivery workflow. So, measure wait times, handoffs, queue lengths, and work-in-progress limits to identify where work gets stuck.
Not Connecting Metrics to Business Outcomes
Engineering productivity should ultimately be connected to outcomes that matter to the business. After all, that’s how you keep the lights on.
High task completion rates don’t always translate directly to revenue, adoption, or customer satisfaction on their own.
Don’t get me wrong; the goal isn’t for engineers to stop completing tasks. But without a business context, there’s no way to tell whether the work being completed is the work that matters to customers and the company.
If you’re building a high-performing engineering team, measure how their execution influences customer value, product velocity, and operational risk.
Tracking Metrics but Not Acting on Them
Another common mistake when measuring engineering productivity metrics is failing to act on the results. Many organizations invest heavily in dashboards and reporting systems, but never establish a process for responding to what the data reveals.
The result is “analysis paralysis.”
Your team ends up with detailed visibility into queues nobody is assigned to clear and cycles nobody is tasked with improving, while leaders admire sophisticated charts.
Here’s the fix:
- Treat metrics as inputs to a hypothesis.
- Then, set an explicit hypothesis (“shorter review queues will reduce cycle time by 20%”), make a specific change, and then revisit the data to confirm whether it worked.
- Lastly, assign a named owner to each key metric who is responsible for investigating changes and recommending a response.
Without that accountability structure, good data produces no action.
Optimizing for Speed While Ignoring Quality and Stability
Pressuring teams to ship faster without guardrails for code quality or system reliability is one of the most expensive mistakes you can make, and its cost is deferred, making it easy to miss in the moment.
In the long run, what you get is:
- Developers burn out
- Technical debt accumulates (without you knowing) until it becomes the bottleneck on every future sprint.
- Change Failure Rate increases and production rollbacks become routine, each costing more in recovery time than the speed gains were ever worth.
Sustainable engineering productivity balances speed, quality, and operational stability. You should pair delivery metrics with developer experience surveys, sustainable pacing, and protected time for technical debt reduction.
If you choose to “move faster at any cost,” the bill is usually too high to pay.
What Are the Core Engineering Productivity Metrics and How Do You Measure Them?
If you’re looking for where to start, I’d recommend the DORA metrics. These metrics remain among the most widely adopted frameworks for measuring software delivery performance and serve as a foundation for broader engineering productivity programs as they focus on delivery performance and operational outcomes rather than engineering activity.
Remember that no single metric tells the story on its own. By combining them, you’ll understand how quickly software moves through the delivery pipeline, how reliably it reaches production, and how effectively your teams respond when things go wrong.
System Delivery & Quality (DORA Metrics)
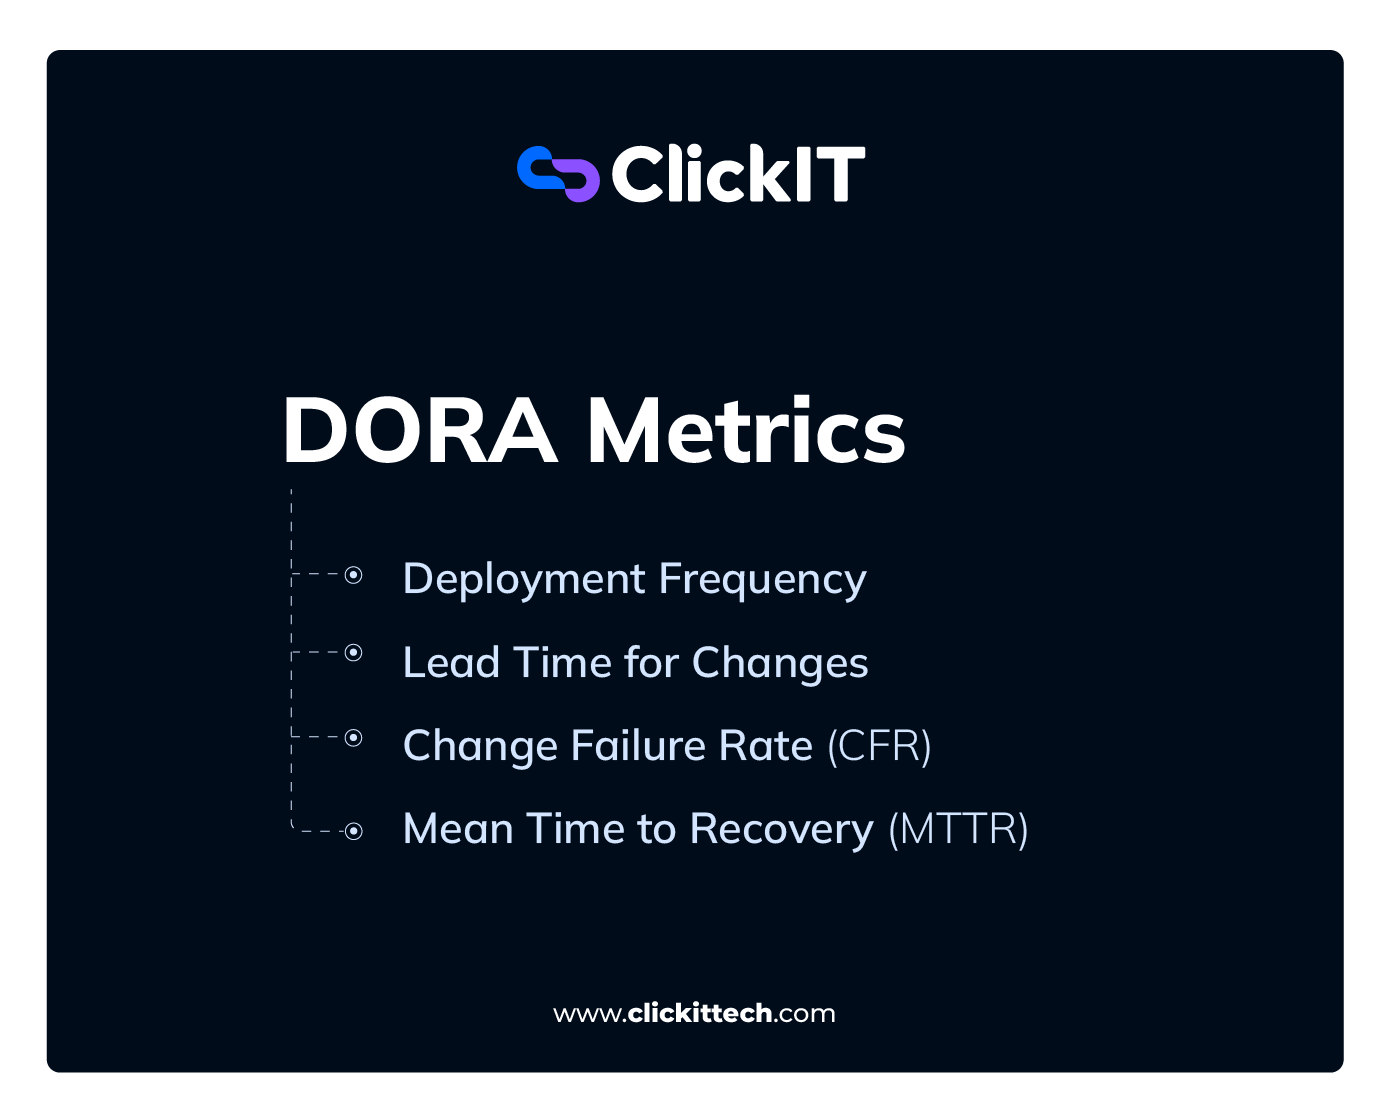
Deployment Frequency
Deployment Frequency measures how often your team successfully ships code to production. For instance, if your team deploys irregularly, you may accumulate larger changesets that are harder to test, review, and roll back.
However, my team deploys small and frequently, which reduces the blast radius when something breaks. It also shows us that the delivery pipeline is healthy enough to ship with confidence.
What deployment frequency helps detect
- Large release batches that increase deployment risk
- Manual release processes that are slowing down delivery
- Overly complex approval workflows
- Low confidence in testing and deployment systems
How to measure deployment frequency
Count the number of successful production deployments over a given period, such as per day, week, or month, depending on your baseline.
According to DORA research, elite performers deploy multiple times per day; high performers deploy once per day to once per week, while medium-to-low performers deploy once a month to once every six months.
So, if your team deploys less than once per month, that pattern may be worth investigating first.
Tools to measure deployment frequency
- GitHub Actions, GitLab CI/CD, Jenkins, and CircleCI log deployment events natively.
- Engineering analytics platforms like LinearB, Swarmia, and Jellyfish aggregate this data and surface frequency trends over time without requiring manual reporting.
Lead Time for Changes
Lead Time for Changes measures how long it takes for code to travel from commit to production. This metric exposes the efficiency of your end-to-end delivery system.
In my experience, a long lead time rarely points to slow developers. Usually, it reveals congestion: code review queues, manual approval gates, slow CI runs, or sequential QA handoffs that could run in parallel.
For example, an engineer spends 4 hours coding a feature and commits it. That commit then sits in a review queue, passes automated tests, and waits for a production release train for 6 days. The Lead Time for Changes is 6 days.
How to measure lead time for changes for engineering productivity metrics
Measure the elapsed time between:
- When the code was committed to version control
- When the code was successfully deployed to production
Quick tip: Remember to break it down into stages (review, build, deploy) to identify where most of the time went. For context, elite DORA performers achieve lead times under one hour, while high performers achieve between one day and one week. Some organizations may also track median lead time rather than averages because averages can be skewed by unusually large projects.
Tools to measure change lead time
- Use LinearB, Swarmia, Hatica, and Jellyfish to automatically track lead time by stage. These tools integrate with your version control and deployment systems.
- GitHub Insights provides a lighter-weight view for teams not ready for a dedicated analytics layer.
Change Failure Rate (CFR)
Change Failure Rate measures the % of deployments that result in a production issue requiring remediation, rollback, hotfixes, or other corrective action. CFR tells you the effectiveness of your testing automation, pre-production validation gates, and overall code quality.
What does Change Failure Rate (CFR) detect
- Weak automated testing coverage
- Poor release validation practices
- High levels of technical debt
- Risky deployment patterns
- Gaps in quality assurance processes
It’s one of the most direct indicators of whether your quality controls are actually working.
How to measure the change failure rate
- Use the formula: (Deployments causing a production incident ÷ Total deployments) × 100. For example, if 5 out of 100 deployments trigger a customer-facing incident (e.g., P1/P2 outages), the Change Failure Rate is 5%.
Change Failure Rate (CFR) = Deployment Triggering a Production Incident
—————————————————————– x100
Total Deployments
- Track rollbacks, hotfixes, and incidents triggered by recent deployments as your numerator. A low CFR generally indicates a healthy balance between delivery speed and software quality.
For context, elite DORA performers maintain a CFR between 0 to 5%. If my CFR is consistently above 30%, then I’ll be worried about pre-production testing or deployment gating structure.
Tools to measure your change failure rate
Because CFR depends on linking deployments to incidents, most organizations combine deployment and observability platforms.
- PagerDuty, Datadog, and New Relic capture production incidents and can attribute them to specific deployments.
- LinearB and Faros AI can help calculate CFR by cross-referencing deployment data with incident data from your monitoring stack.
- Other tools like Grafana Cloud, Splunk Observability, Sentry, and Honeycomb are also useful.
Mean Time to Recovery (MTTR)
Also called Time to Restore Service, MTTR measures how long it takes to recover from a failed deployment, incident, or system failure. It directly reflects your team’s capacity to respond under pressure, such as:
- the speed of detection
- clarity of runbooks
- efficiency of escalation paths,
- and the readiness of on-call teams.
A low MTTR often indicates strong observability, effective incident response processes, clear ownership, and well-documented operational procedures.
However, you should always aim for low CFR and MTTR. Beyond the technical impact, extended recovery times affect customer retention, service availability SLAs, and developer morale.
How to measure Mean Time to Recovery
MTTR = Total recovery time ÷ Number of incidents
For example, if 5 incidents require a combined 10 hours to resolve, your MTTR is two hours.
To effectively measure MTTR, do the following:
- measure from the moment an incident is detected to the moment service is restored.
- Segment by severity to distinguish between recoveries that take minutes and outages that take hours, since averaging them together obscures the patterns worth acting on. Elite DORA performers restore service in under one hour.
- Track MTTR trends over time rather than focusing on isolated incidents.
Tools to measure MTTR
- Use PagerDuty and OpsGenie to manage incident-response workflows and automatically track log-resolution timelines.
- Datadog and New Relic provide real-time monitoring and alerting that reduces detection time.
- FireHydrant and incident.io centralize incident management and generate MTTR reports from resolution data.
- To build recovery readiness before incidents occur, Gremlin enables chaos engineering drills that test your team’s response in a controlled environment.
- I recommend AWS Fault Injection Service for teams operating within AWS infrastructure.
Process & Efficiency Metrics
DORA metrics tell you how effectively software reaches production. Process metrics help explain why delivery is fast or slow by revealing friction inside the engineering workflow.
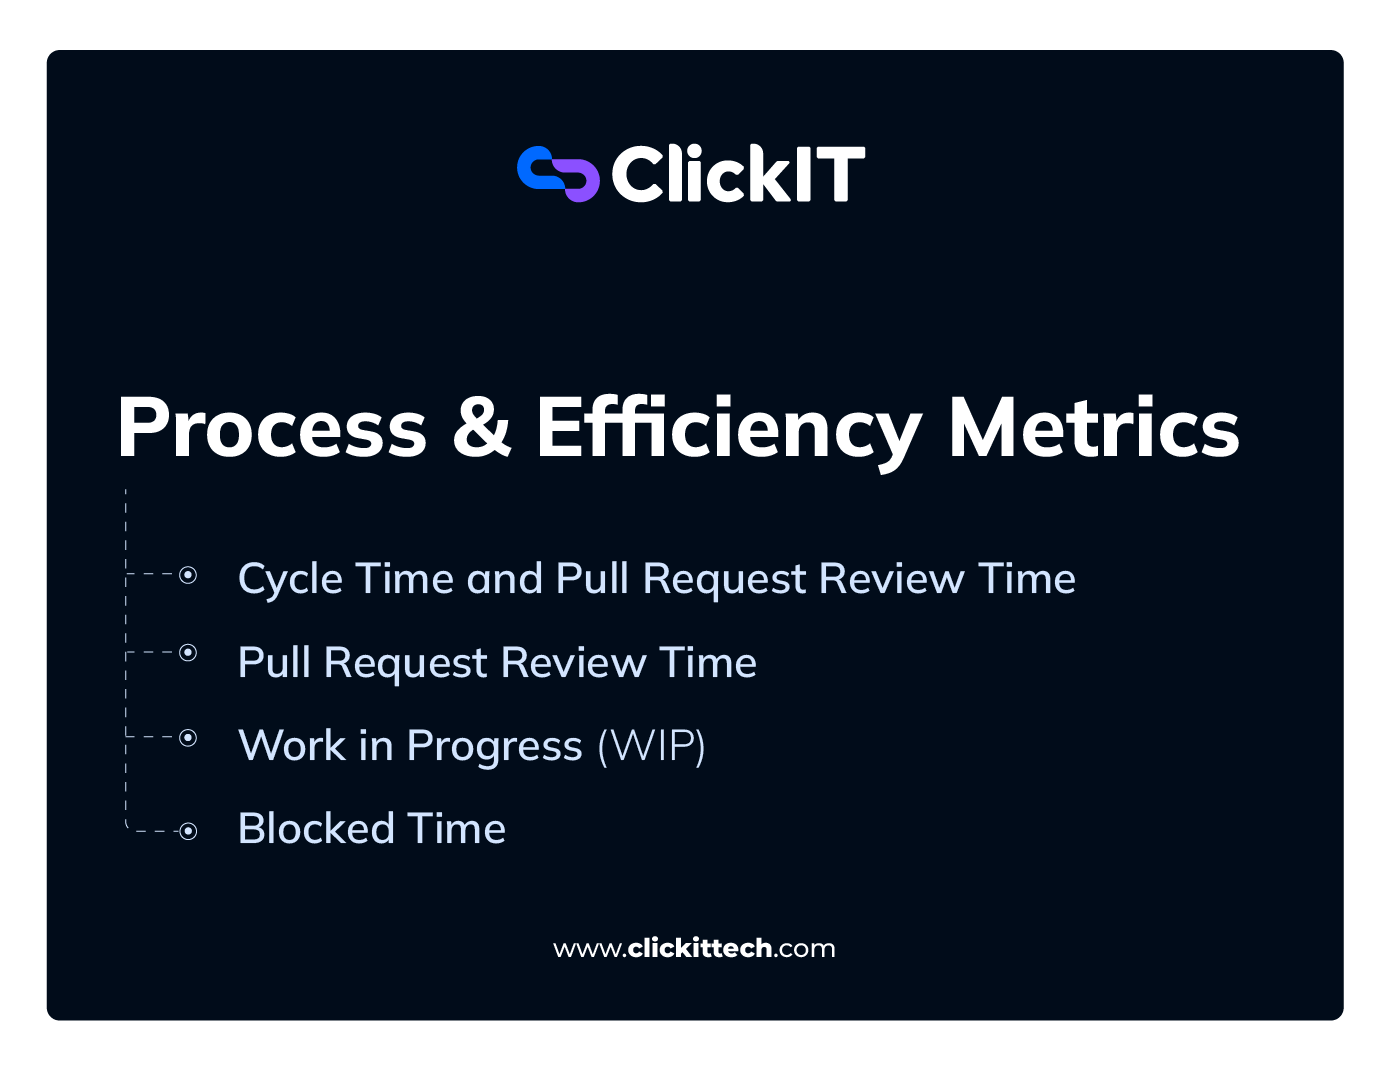
Cycle Time and Pull Request Review Time
Cycle Time measures the elapsed time from when work starts to when it reaches production.
Unlike lead time for changes (which starts when code is committed), Cycle Time provides visibility into the broader development process and reveals where work slows down before customers receive value.
It is one of the clearest indicators of delivery efficiency because it captures both engineering effort and the delays that occur around it.
PR Review Time measures the time elapsed from when a pull request is opened to when it receives its first review. In essence, it answers the question: how much delivery delay is caused specifically by code review?
Together, cycle time and PR review time help detect the following:
- Collaboration friction
- Reviewer overload
- Large pull requests
- Excessive work-in-progress
- Cross-team dependencies
How to measure cycle time
Track the elapsed time between:
- Work actively on a task, feature, or ticket.
- That work is being deployed to production or marked complete.
Cycle Time = Completion Date − Work Start Date
Many engineering leaders also compare the estimated delivery time with the actual Cycle Time.
Pull Request Review Time
PR Review Time measures the time from when a pull request is opened to when it receives its first meaningful review.
Slow review cycles increase context switching because your developers must repeatedly revisit work they thought was complete.
How to measure PR review
Track the time between:
- Pull request creation.
- First meaningful review, comment, or approval.
Tools to track cycle time and PR review
Integrated solutions like GitLab Analytics and GitHub Enterprise, alongside specialized platforms like LinearB, Swarmia, and Jellyfish, provide visibility into development bottlenecks by analyzing git history, deployment frequency, and workflow data.
Work in Progress (WIP)
Work in Progress (WIP) is a flow metric that measures how many tasks have been started but not yet completed.
Interestingly, many teams assume that starting more work increases productivity. In practice, excessive WIP often slows delivery because developers are forced to split attention across multiple priorities.
What WIP helps detect
- Context switching
- Team overload
- Bottlenecks in delivery pipelines
- Resource allocation issues
If my engineers are juggling too many active tasks simultaneously, none of them move quickly, and the cognitive overhead piles up.
How to measure WIP
Track the number of active work items in each workflow stage below.
Track WIP at three levels.
- Task count per workflow stage (in progress, in review, QA, ready for deployment): count active items in each column of your Kanban board to see where work is accumulating.
- Per-developer WIP
- Work Item Age, which measures how long an unfinished item has remained active. Aging work is sometimes an early warning sign of hidden bottlenecks.
For a more rigorous model, you may also apply Little’s Law:
Average Lead Time = Average WIP / Average Throughput (Where throughput is the average number of completed items per time period)
Quick tip for your data integrity: Establish clear definitions of what “started” and “finished” mean before tracking, or the metric will measure process hygiene as much as actual workflow health.
Many teams also establish WIP limits. In my experience, developers managing more than three active work items simultaneously tend to experience significant drops in focus and delivery speed.
Tools to track work in progress
Jira, Linear, Azure DevOps, Asana, Shortcut, Monday.com
Blocked Time
Blocked time measures the duration a task spends paused because an engineer is waiting on something outside their control: an approval, an external team dependency, unclear requirements, or an environment that isn’t ready. It is one of the more honest metrics available because it captures time lost to organizational friction rather than individual performance.
Unlike cycle time, which measures overall duration, blocked time identifies periods during which no meaningful progress can occur.
What Blocked Time Detects:
High blocked time exposes systemic issues like:
- External dependencies that aren’t being managed proactively,
- Requirement handoff failures,
- Unclear requirements
- Infrastructure bottlenecks slowing engineering down regardless of team capability.
- Cross-functional coordination issues
A team with a healthy cycle time overall but high blocked time is succeeding despite friction, which means there’s headroom being left on the table.
For example, an engineer finishes a feature in 4 hours but cannot deploy it because the staging environment crashed or they are awaiting a compliance sign-off. If this delay lasts 6 days, leaving the original ticket “open and blocked” can distort team velocity metrics and lead to context-switching.
Instead, best-practice teams pivot the engineer to a new task (if the blocker is unlikely to clear quickly) and log the bottleneck as a separate, linked tracking ticket. When calculating this duration, you must measure active business hours rather than calendar days. If a task is blocked on a Friday afternoon and resolved Monday morning, counting it as a “3-day block” artificially inflates organizational friction by including weekends and non-working hours.
How to measure blocked time and tools to use in engineering productivity metrics
- Track the cumulative time tickets spend in a “blocked” or “waiting” status within your project management system.
- Make sure you segment by blocker type: external dependency, approval wait, environment issue, and unclear specification. The segmentation is what gives you the actionable insight.
Tools: Jira and Linear support blocked status flags natively. Swarmia and LinearB surface blocked time as a flow metric and can alert teams when tasks exceed a defined blocked threshold.
Business & Allocation Metrics
Engineering productivity metrics ultimately exist to create business value. The metrics below will help you understand whether engineering capacity is being invested in the right places.
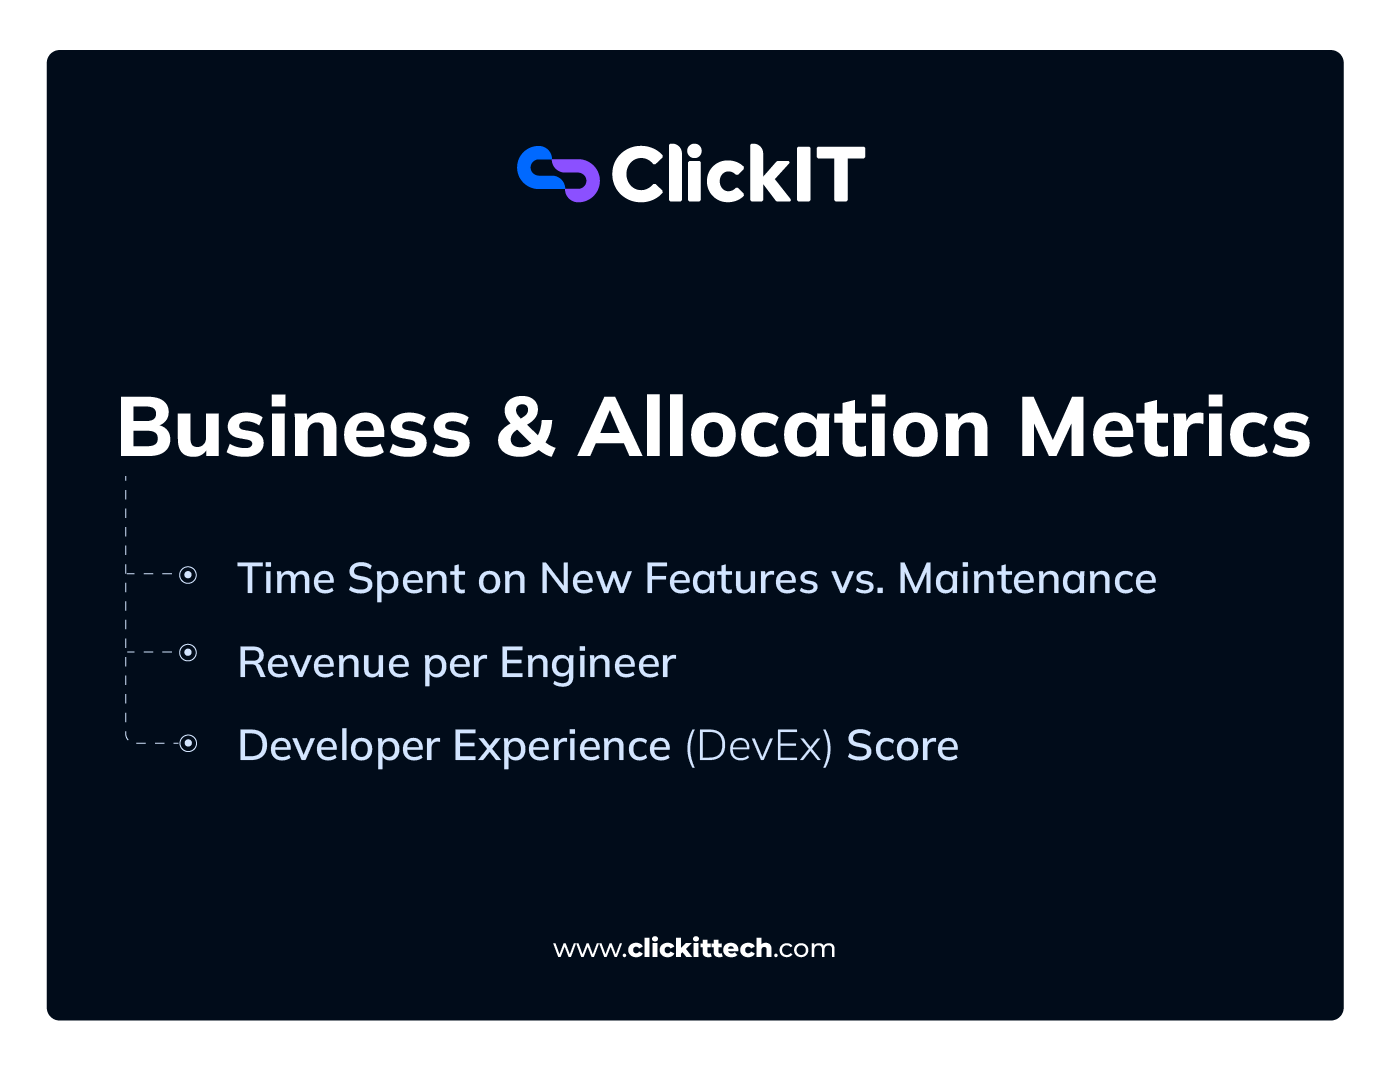
Time Spent on New Features vs. Maintenance
This metric measures how engineering capacity is split between building new product capabilities and maintaining existing systems (sometimes called KTLO or Keep the Lights On). It reveals whether your team is primarily advancing the product or being consumed by the cost of keeping current systems stable and functional.
Every organization needs both. The problem starts when maintenance and support work starts consuming the time spent innovating.
What this metric helps detect
- Growing technical debt accumulation
- Excessive support burden
- Aging infrastructure
- Reduced innovation capacity
When maintenance time exceeds 30% of total engineering capacity, treat this as a signal that infrastructure and code quality need structural attention. For instance, Shopify dedicates 25% of its development cycles to addressing technical debt.
How to measure time spent on new features vs. maintenance
Track the percentage of developer hours or story points allocated to new features versus bug fixes, production incidents, refactoring, and technical debt reduction.
The most reliable method is ticket tagging at creation (with strict discipline): categorize every Jira, Linear, or Asana issue as Feature, Bug, Tech Debt, or Refactor, and track story points or hours logged to each.
Additionally, version control analysis, review of commit history, and the PR types merged into the main branch provide a useful secondary signal.
A lot of engineering leaders I work with use one of two allocation frameworks:
- 60 / 20 / 20: 60% new features, 20% maintenance and bug fixes, 20% technical debt and infrastructure improvements.
- 40 / 20 / 40: 40% new features, 20% maintenance, 40% technical debt, and infrastructure. This distribution makes sense for products with significant accumulated debt or for those operating in regulated environments where stability requirements are higher.
The right split depends on product maturity. For instance, early-stage products trend toward 60/20/20. The goal for new feature time is to maximize what your most experienced engineers spend on work that drives revenue or strategic value. For maintenance, the goal is to keep it as low as safely possible so it doesn’t cannibalize feature delivery capacity.
Revenue per Engineer
Revenue per Engineer is a high-level financial efficiency metric that measures how effectively an organization translates engineering headcount and investment into business output. It is one of the few engineering productivity metrics that speaks directly in the language of a board or CFO.
What it helps detect
- Engineering efficiency trends
- Scalability of delivery systems
- Whether engineering investment is generating business returns
Read our blog on How to Justify AI Investments to CFO and Board
Because many factors influence revenue, this should be treated as an executive-level business metric rather than a direct measure of individual engineering productivity.
Formula for measuring Revenue per Engineer (RpE)
Revenue per Engineer = Total Annual Revenue ÷ Total Engineering Headcount
Industry benchmarks suggest a median RpE of approximately $892K, with top-quartile companies (large, public tech giants) achieving $1.5M or more.
Please note: these figures vary significantly by your business model, company stage, and whether the product is engineering-led or sales-led, so treat them as directional comparators rather than hard targets.
Tools to track RpE
- ERP systems like SAP, NetSuite, or Workday Financials
- Financial planning platforms like Anaplan, Workday Adaptive Planning
- HRIS systems like Workday HCM, BambooHR, or Rippling
- Business intelligence tools like Microsoft Power BI and Looker
Developer Experience (DevEx) Score
Developer Experience has become one of the most important engineering productivity metrics in 2026. DevEx measures how engineers perceive their tools, workflows, and work environment.
The reason is simple: developers spend a significant portion of their time working across tools, processes, documentation, and internal systems. So, we need to know what they think about them.
Teams with strong DevEx scores ship faster and retain their best engineers longer.
What it helps detect
- Tooling friction
- Cognitive overload
- Documentation gaps
- Developer frustration
- Poor onboarding experiences
How to measure DevEx
The SPACE framework from Microsoft Research (Satisfaction, Performance, Activity, Communication/Collaboration, Efficiency) and the DX Core 4 framework provide structured, research-backed approaches to measuring DevEx.
Use periodic surveys and platform analytics to evaluate:
- Ease of deployment
- Ease of testing
- Time spent waiting
- Documentation quality
- Developer satisfaction
Tools to track DevEx
- DX
- Jellyfish
- Pluralsight Flow
- Developer surveys
- Internal engineering health assessments
How AI Is Changing Engineering Productivity Measurement
For as long as I can remember, engineering productivity discussions were mainly about writing code. In 2026, that’s no longer the primary bottleneck. With agentic tools now opening pull requests on their own, the constraint has moved downstream, to reviewing, verifying, and integrating code faster than it gets generated.
Where AI is delivering real gains
Devs using AI assistants like GitHub Copilot, Cursor, and Cody complete isolated coding tasks and write boilerplate significantly faster than before. In fact, a Microsoft Research study had software developers implement an HTTP server in JavaScript as quickly as possible. Developers with access to an AI pair programmer completed the task 55.8% faster than the control group.
That said, this was a narrowly scoped, greenfield task; in large, established codebases, where most of the effort goes into understanding existing systems, those gains shrink considerably.
Ten years ago, that speed and output would’ve been a breakthrough in productivity measurement. Today, this shift makes activity-based metrics even less useful than they were before.
How AI is making it harder to measure engineering productivity metrics
As AI increases coding speed and output, engineering organizations are discovering that code review, validation, testing, and system design are becoming the new constraints.
Here are some interesting data points from Faros AI’s 2026 engineering report:
- Incident rates associated with deployments have increased 242.7%. This is particularly concerning if your team prioritizes output volume over engineering discipline.
- Bugs per developer are up 54% in some organizations despite faster development cycles.
- Code churn has risen by 861% as teams rewrite, refactor, and replace AI-generated implementations.
Quality Inconsistencies
AI models are very good at producing locally correct code, meaning they produce code that runs and passes surface-level tests, rather than code that will always integrate cleanly with your existing systems.
For example, a team generates a week’s worth of code in a single afternoon, only to spend the next week (or longer) reviewing, testing, and refining it.
Longer Code Reviews
Personally, reviewing AI-generated code is cognitively harder than reviewing code a colleague wrote, because I must reconstruct intent from output rather than from context I already share. That context may come from previous code reviews, architecture discussions, design decisions, or incident postmortems.
Unless it is explicitly documented, an AI-generated implementation may come without the reasoning that led to it, requiring me to spend more time validating assumptions, understanding trade-offs, and assessing how the code fits into the broader system.
How to adapt your engineering productivity metrics measurement approach to code reviews
Prioritize Relevant Metrics
All the engineering productivity metrics we discussed above matter. If you’re specifically looking for metrics to review code quality and delivery in an AI-assisted environment, prioritize the following:
- Change Failure Rate: With incidents per PR up 242.7%, CFR becomes an important quality signal in an AI-heavy environment. It tells you whether AI-assisted code is stable in production.
- Code churn rate: Tracks how much recently merged code gets rewritten or reverted shortly after. High churn in AI-assisted work shows that code is being accepted faster than it’s being understood. To calculate code churn rate, use
Code Churn Rate = Lines deleted or modified within X days of being written / Total lines written × 100.
- Cycle time: Measures end-to-end delivery, including review overhead, which accounts for the cognitive cost AI creates, not just the coding speed it enables.
- Escaped defect rate: Bugs from AI-generated code that cleared pre-production review are a direct indicator of review quality..
- Deployment frequency paired with CFR: Read together, these tell you whether the team is shipping value or “just shipping.” High deployment frequency, alongside rising CFR, means speed comes at a stability cost.
Automated Code Reviews
It’s okay to run AI code review tools as a first-pass triage layer before AI-generated code reaches a human reviewer. Tools like CodeRabbit, GitHub Copilot Code Review, Amazon CodeGuru Reviewer, Snyk Code, and Qodo catch basic errors, style inconsistencies, and security vulnerabilities automatically, reducing cognitive load on senior engineers and shortening review queues. Then my attention as a senior reviewer goes to architecture, intent, and systemic fit, which is a better use of my time.
PR Size Discipline
Requiring AI-assisted changes to be scoped to 200-400 lines forces a level of decomposition that makes review tractable and makes churn identifiable earlier.
Large AI-generated PRs are difficult to review well (longer logic chains, larger blast radius for oversights), and reviewers may approve more than scrutinize if the scope is overwhelming.
In summary, the guidelines here should be:
- Single-purpose pull requests
- Small review batches
- Frequent incremental deployments
- Pull requests scoped to 200 to 400 lines of net-new code, where practical
Remember that AI acts as a multiplier; it accelerates good practices if they are already in place, but can introduce code bloat and technical debt if human oversight slips.
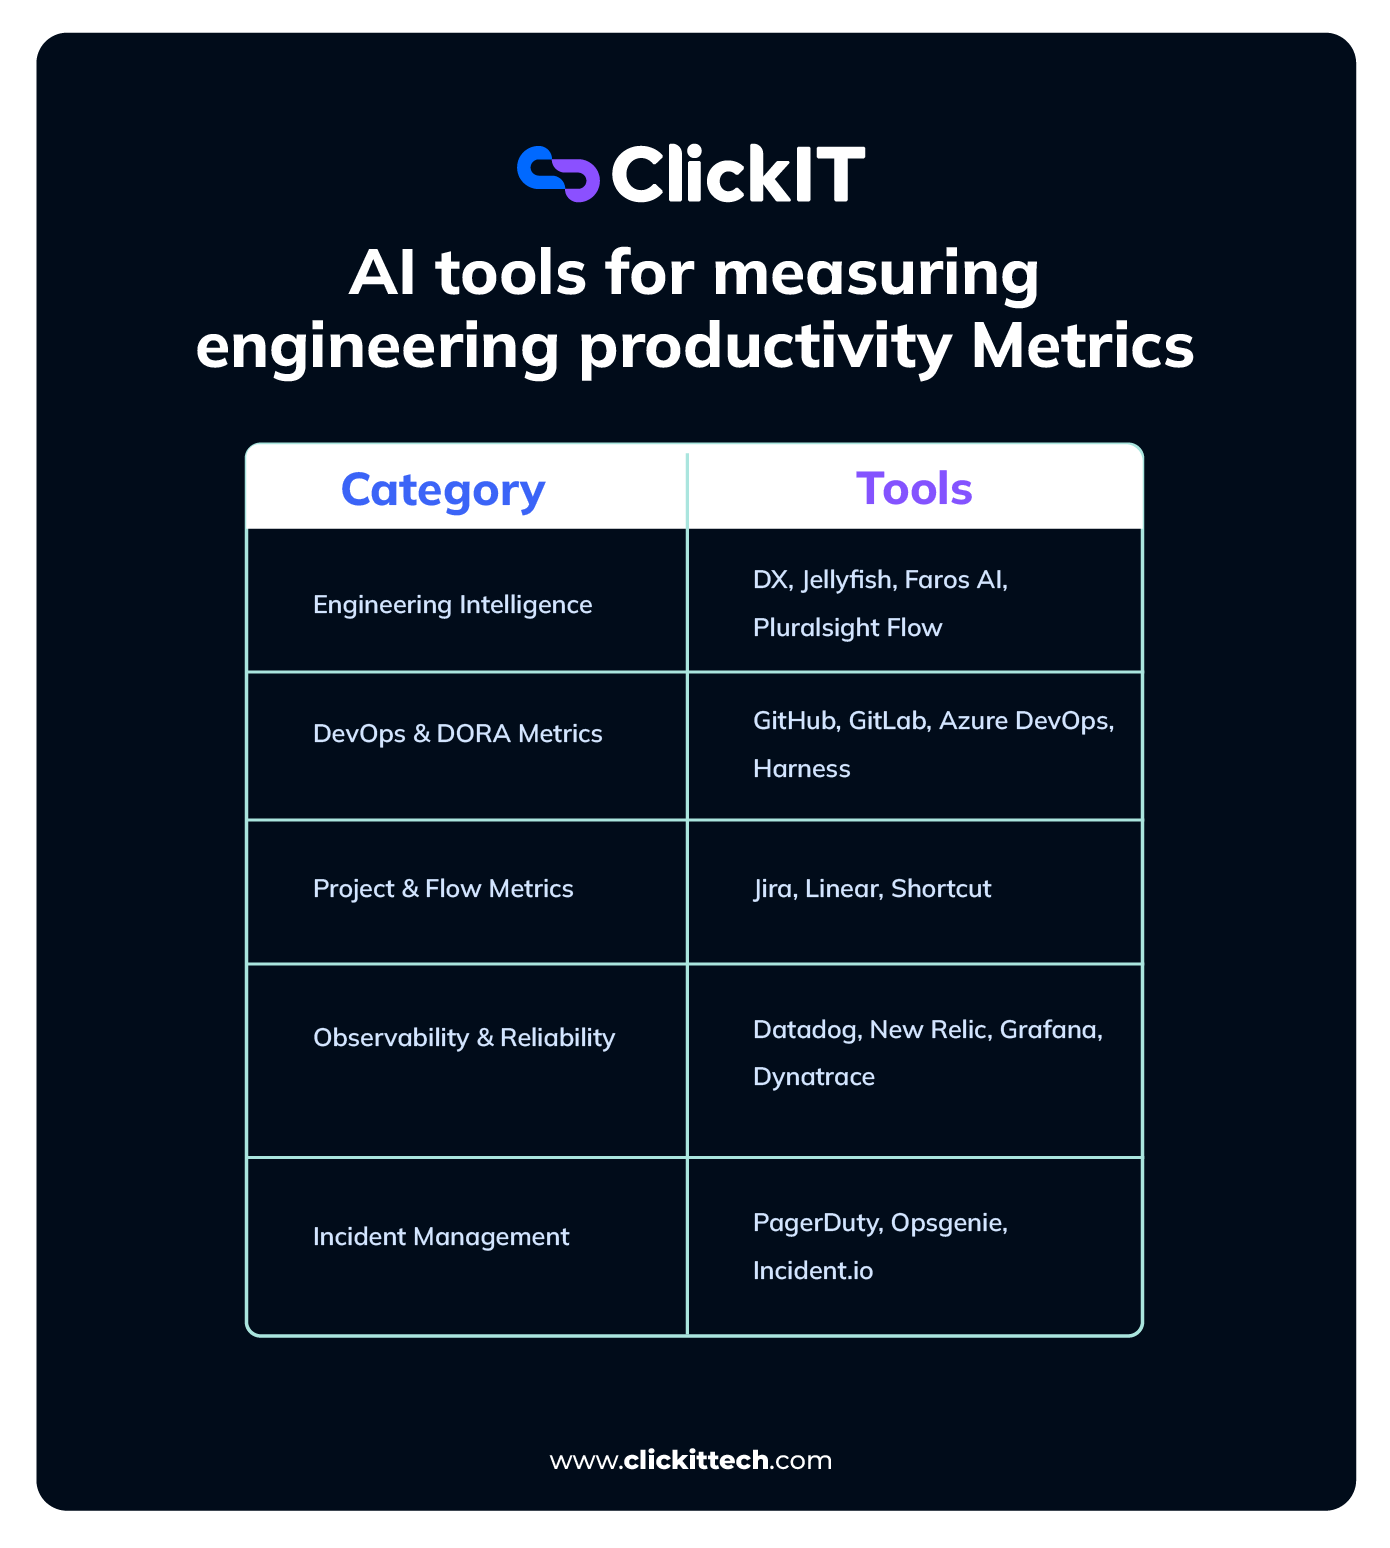
AI tools for measuring engineering productivity Metrics
FAQs
The most useful engineering productivity metrics are Deployment Frequency, Lead Time for Changes, Cycle Time, Change Failure Rate, Mean Time to Recovery (MTTR), Work in Progress (WIP), and Developer Experience (DevEx) metrics.
Software engineering teams should focus on outcomes rather than activity. Measure how efficiently work moves through the delivery pipeline, how reliably software reaches production, and the business value created for customers.
Engineers respond to the incentives that metrics create. Well-designed metrics encourage collaboration, quality, and customer value. Poor metrics will lead to gaming behavior, unhealthy competition, office politics, and an emphasis on output over outcomes.
DORA metrics are a widely adopted framework for measuring software delivery performance. They include Deployment Frequency, Lead Time for Changes, Change Failure Rate, and Mean Time to Recovery (MTTR). More recent DORA research adds reliability, measured as operational performance against your SLOs, as a fifth metric.
There is no single best metric that measures engineering productivity. High-performing organizations combine delivery metrics such as Lead Time for Changes and Cycle Time, quality metrics such as Change Failure Rate and MTTR, business outcomes such as Revenue per engineer and customer adoption, and developer experience metrics to gain a complete view of performance.
AI can significantly increase coding speed and reduce repetitive work. However, true productivity improvements depend on maintaining code quality, reliability, and customer impact rather than simply generating more code.