
Engineering teams are under constant pressure to deliver new capabilities, support AI-driven features, maintain legacy systems, and scale infrastructure. However, behind this speed, many tech leaders are fighting an invisible battle: How to reduce technical debttechnical debt.
Debt quietly accumulates in codebases, architectures, documentation, and even team processes. Over time, technical debt doesn’t just affect code quality; it also impacts business agility, customer experience, and, ultimately, revenue.
GenAI adds even more. Prompt sprawl, tool-selection chaos, opaque LLM chains, and feedback flywheels that never materialize are just a few.
For many organizations, the biggest challenge is not just recognizing technical debt but knowing how to reduce it without slowing innovation.
Here are the key pain points tech leaders face today with technical debt:
- Slower feature delivery: Engineers spend more time understanding and fixing old code than building new capabilities.
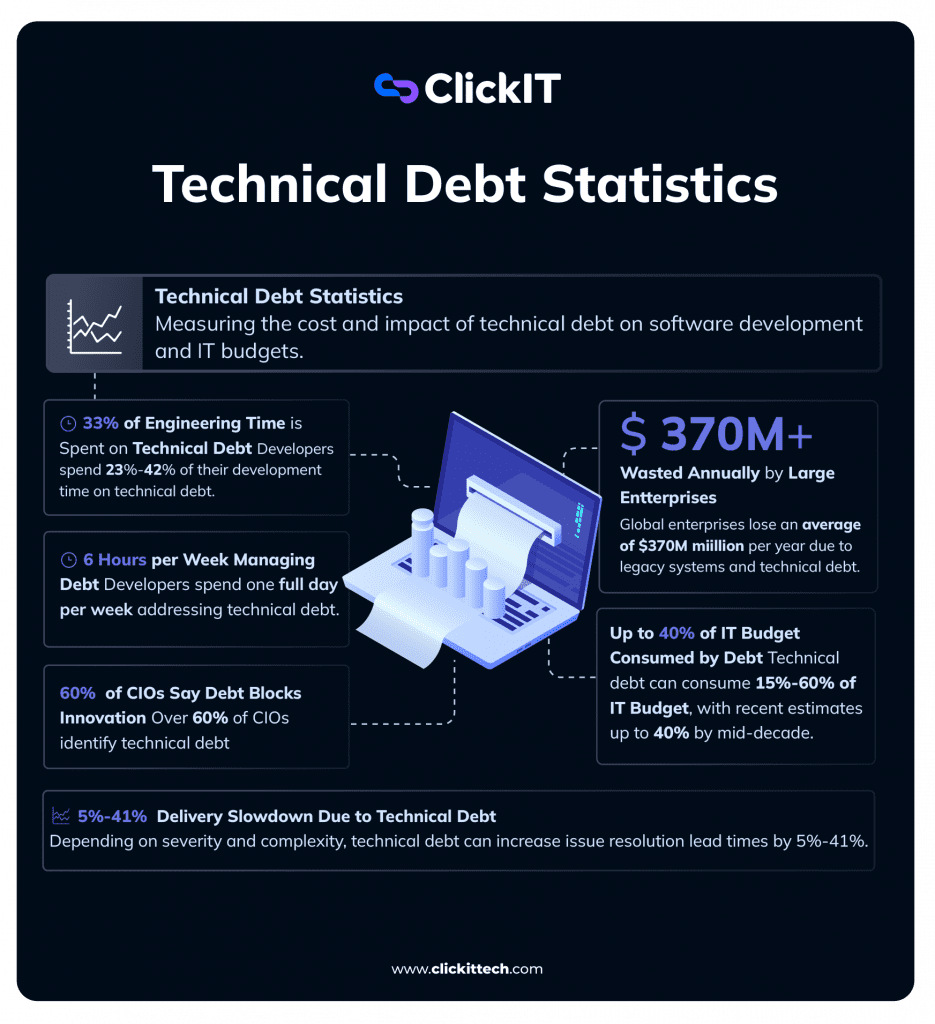
As per Forbes, engineers spend roughly one-third of their time dealing with technical debt instead of building new features.
- Rising maintenance costs: Legacy components require disproportionate effort to maintain.
As per Savanta research, Enterprise organizations waste $370 million per year dealing with legacy systems and technical debt.
- Higher production risk: Technical debt increases system fragility, leading to outages and security vulnerabilities.
- Reduced developer morale: Engineers prefer building new systems rather than constantly patching outdated ones.
- AI and digital transformation blockers: Organizations adopting AI and automation often discover their existing systems can’t support modern data and compute requirements.
This blog is a complete guide designed specifically for decision-makers responsible for technology strategy and execution, including:
- Chief Technology Officers (CTOs) are balancing innovation with system stability
- Chief Executive Officers (CEOs) aligning technology investments with business growth
- Chief Operating Officers (COOs) ensure operational reliability and cost efficiency
- Vice Presidents of Engineering managing delivery velocity, architecture health, and team productivity
- Senior Engineering Leaders responsible for platform scalability and technical roadmap planning
Blog Overview
- Technical debt slows delivery, increases risk and costs, and prevents teams from innovating as engineers spend up to one-third of their time managing it.
- Reducing technical debt starts with proper measurement using audits, metrics, and engineering feedback to identify high-impact areas.
- Successful organizations manage technical debt continuously through incremental refactoring, automation, and dedicated engineering capacity.
- Prioritization should focus on business impact, addressing debt that affects revenue, reliability, security, and customer experience.
- Technical debt management requires leadership support, a strong engineering culture, and alignment with business strategy.
- The goal is not zero technical debt, but sustainable, well-managed systems that support long-term scalability and innovation.
Read the blog 10 Engineering Metrics Teams Must Follow
How To Identify and Measure Technical Debt?
One of the biggest mistakes I see organizations make in preventing technical debt is attempting broad cleanup initiatives without data.
Before thinking about how to reduce technical debt, we must first understand where it exists, how severe it is, and how it impacts business outcomes. Moreover, it is important to understand that technical debt identification is an ongoing discipline, not a one-time exercise.
a) Identify Why Do You Need a Technical Debt Audit
Atechnical debt audit provides a clear baseline of system health. Without it, decisions are based on anecdotal complaints or isolated incidents rather than measurable risk.
Technical debt reduction is not about fixing everything. It is about fixing the right things first. This is where a technical debt audit becomes crucial.
A debt audit achieves several critical goals:
- Uncovers hidden issues that metrics alone miss, such as architectural coupling or outdated infrastructure patterns.
- Quantifies the business impact as to how much velocity, risk, or cost is tied to debt.
- Builds a shared understanding across engineering, product, and executive teams.
- Provides a baseline to track progress over time.
A comprehensive audit typically evaluates three major layers:
- Code-Level Debt: This includes issues that directly impact maintainability and development velocity.
Examples:
- Duplicated logic across services
- Overly complex functions or classes
- Poor test coverage
- Outdated frameworks or libraries
- Inconsistent coding standards
Code debt usually shows up as slower development cycles and higher bug rates.
- Architecture Debt: Architecture debt is often the most expensive and hardest to fix.
Examples:
- Tight coupling between services
- Monolithic bottlenecks limiting scalability
- Poor data model design
- Missing event-driven or asynchronous patterns where needed
- Inflexible integration layers
Architecture debt directly affects scalability, reliability, and the ability to adopt AI or advanced analytics systems.
- Infrastructure and Platform Debt: Infrastructure debt is frequently overlooked but has a major operational impact.
Examples:
- Manual deployment pipelines
- Lack of infrastructure-as-code
- Inconsistent environments
- Outdated cloud resource configurations
- Missing observability and monitoring
This type of debt often increases downtime risk and slows incident response.
b) Combining Qualitative and Quantitative Signals
The best technical debt measurement strategies combine human insight with system-generated metrics.
Qualitative Signals: Engineer and Team Feedback
Engineers often know where the real technical debt lives, long before dashboards show it. This is because they live in the code daily and are the first ones to feel the pain points.
We can capture this feedback through:
| Sources of Qualitative Input | Feedback |
| Developer Surveys and Architecture Review DiscussionsSprint RetrospectivesOnboarding Feedback from New Engineers | Common responses from Engineers:“Every change here breaks something else.”“We avoid touching this module.”“This service is impossible to test safely.”“Deployments here are always risky.” |
| Pain-point Sessions | Run 30–60 minute workshops where teams map friction areas using tools like Miro or FigJam. |
| Incident Postmortems and Reviews | These often reveal systemic debt. For eg, flaky tests, brittle configs |
| Developer Experience Metrics | Tools like Stepsize AI or LinearB can surface sentiment from commit messages, PR comments, and ticket patterns. |
These signals are extremely valuable for identifying hidden or emerging debt.
Quantitative Signals: Metrics and Data
Quantitative metrics provide objectivity and trend tracking over time. They are critical for executive-level reporting and prioritization.
Key Metrics to Measure Technical Debt
- Code Complexity Metrics: Measures how difficult code is to understand and modify.
Examples:
- Cyclomatic complexity
- Cognitive complexity
- Method length and class size
For example, high cyclomatic complexity (>15–20 per method) indicates hard-to-test, error-prone sections.
- Test Coverage: Measures how much of your code is validated through automated testing.
Important signals:
- Unit test coverage percentage
- Integration test coverage
- Critical path test coverage
Low test coverage increases release risk and slows refactoring, making it harder to reduce technical debt safely. It is recommended to aim for 70–80%+ on critical paths.
- Technical Debt Ratio: Many tools estimate technical debt as the ratio of remediation cost to development cost.
Remediation effort ÷ development effort (often expressed as %).
For instance, if fixing debt would take 3 months and the system took 12 months to build, the Debt Ratio = 25%
This helps leaders compare debt across teams and systems.
- Change Failure Rate: From DORA metrics
Check how often deployments cause incidents or rollbacks. A higher failure rate often indicates underlying debt.
- Lead Time for Changes: If simple changes take weeks instead of days, technical debt is usually a major factor.
- Mean Time to Recovery (MTTR): Long recovery times mean architecture or infrastructure debt.
Don’t let legacy code stall your AI roadmap.We help VPs of Engineering modernize their core platforms. Let’s Future-Proof Your Architecture
c) What are the Tools to Measure Technical Debt?
Most organizations combine multiple tools depending on the stack and maturity level.
| Task | Tools | Results |
| Code Quality and Static Analysis Tools | SonarQubeCodeClimateSnyk (for dependency and security debt)ESLint / Pylint / language-specific linters | These tools provide automated detection of code smells, vulnerabilities, and maintainability risks. |
| Engineering Metrics Platforms | LinearBJellyfishPluralsight Flow | These tools help connect technical metrics to business outcomes. |
| Cloud and Infrastructure Observability Tools | DatadogNew RelicGrafana + Prometheus | These tools help surface infrastructure-related technical debt through reliability signals. |
A Quick Review of Popular Tools in this segment:
| Tool Name | Key Feature | Pros |
| SonarQube / SonarCloud | Gold standard for static analysis | Calculates technical debt in days/hours, TDR, complexity, duplication, and coverage gaps. Integrates into CI/CD. |
| CodeClimate | Great for GitHub workflows. | Focuses on quality trends, assigns letter grades (A–F), and tracks debt over time. |
| vFunction | Architectural debt specialist | Maps dependencies, visualizes monolith-to-microservices debt, and identifies entanglement. |
| CAST Highlight | Portfolio-level view | scans entire application estates for debt, cloud readiness, and open-source risks. |
| Stepsize AI / LinearB / Swarmia | Engineering intelligence platforms | Combine code metrics with velocity, churn, and developer signals. |
| Evidently AI, WhyLabs, Arize (ML-Specific | Production ML Model monitoring | For data/model drift and pipeline health. |
d) Focus on High-Impact Areas First
As per my experience, one of the most important leadership principles in technical debt reduction strategies is prioritization.
Trying to eliminate all technical debt at once usually fails because it stalls product delivery, and the teams lose their main focus. Most importantly, new debt continues accumulating. There is also a risk of business stakeholders losing confidence.
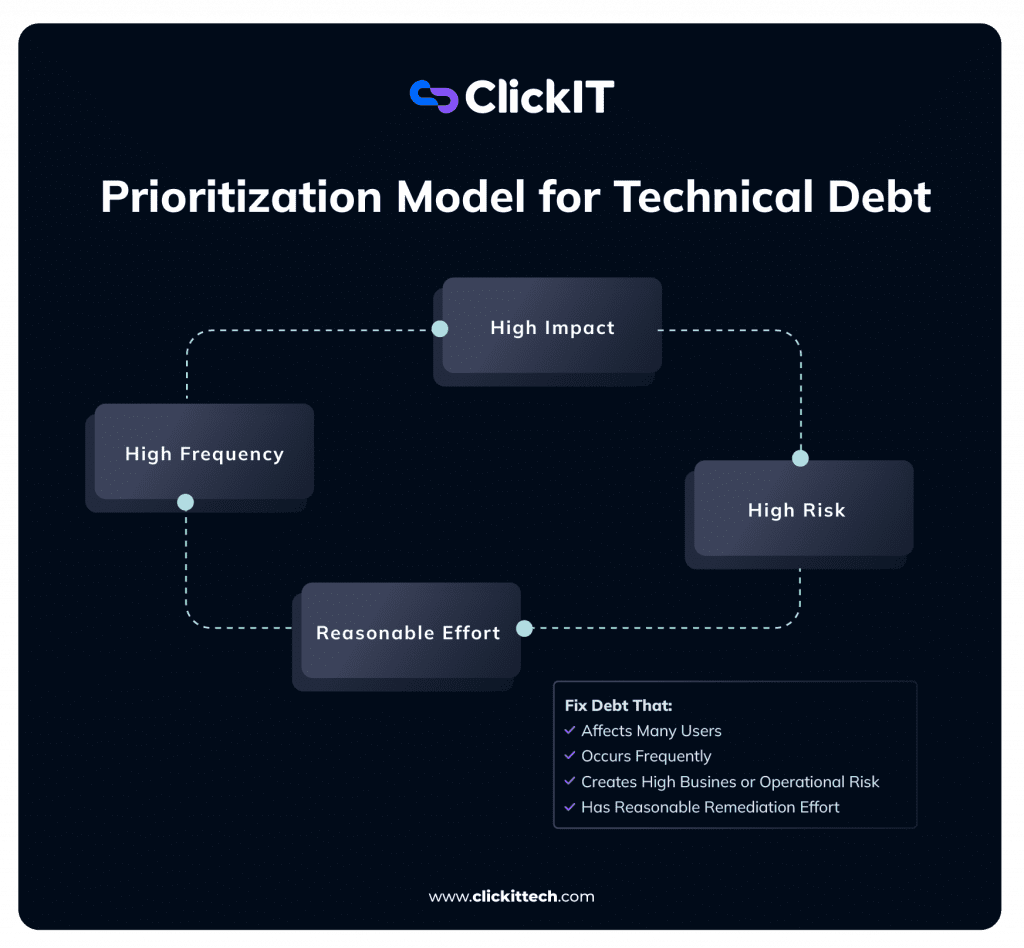
So, focus on high-impact debt that:
- Directly slows revenue-generating features
- Creates production reliability risk
- Blocks AI, data, or platform modernization
- Causes repeated incidents or customer complaints
- Consumes disproportionate engineering time
A useful prioritization model:
Impact × Frequency × Risk × Effort
e) Build a Continuous Technical Debt Visibility Loop
Leading organizations treat technical debt measurement as continuous, not periodic.
Best practices include:
- Quarterly technical debt reviews at the leadership level
- Debt metrics included in engineering dashboards
- Debt tracking in backlog with business priority scoring
- Linking debt items to customer or revenue impact
This ensures that technical debt stays visible and actionable.
How to Decide What to Fix First?
Once you identify your technical debt through audits, metrics, and team feedback, the real challenge begins: deciding what to tackle and when. One of the biggest misconceptions about how to reduce technical debt is that teams should fix the worst code first.
Prioritize Based on Business Impact, Not Engineering Preference
I see most organizations make the mistake of letting engineering preferences dictate the order.
In reality, effective technical debt reduction is not driven by engineering discomfort but by business impact. Engineers enjoy refactoring code that is hard to work with, but it might offer limited business value given the effort required.
Our goal is not perfection here. It is maximizing business value while minimizing delivery risk.
Don’t ask, “ What code is ugly?” Instead, ask “What technical debt is costing us money, customers, or growth?”
Debt should be prioritized based on its effect on:
- Revenue generation
- Customer retention and experience
- System reliability and uptime
- Security and compliance exposure
- Time-to-market for strategic initiatives
- AI and digital transformation readiness
Consider real-world scenarios:
- A brittle checkout service might be only 5% of the codebase but causes 40% of production incidents and lost revenue during peaks.
- An outdated ML feature pipeline may block new AI experiments that could drive differentiation.
- A security-vulnerable dependency might seem minor until it triggers a breach or compliance violation.
So prioritize the impact:
| Real World Scenarios | Priority Level |
| Legacy payment service is causing transaction failures | Critical |
| Core API is slowing new feature delivery | High |
| Rarely used internal tool with messy code | Low |
| Deprecated UI component not affecting users | Lowest |
Tie Technical Debt Fixes to Measurable Outcomes
We can easily justify technical debt when we tie it directly to business metrics or tangible outcomes. This shifts conversations from cost to investment.
| Business Metrics | Technical Debt Details |
| Revenue Risk | Debt is causing downtime, slow performance, cart abandonment, or blocked features |
| Reliability and Incident Burden | High change failure rate, frequent on-call pages, or long MTTR tied to flaky components |
| Security and Compliance | Outdated libraries with known CVEs, missing encryption, or audit failures. |
| Customer Experience | Latency, poor UX from legacy frontends, or inconsistent model outputs in AI features. |
| Velocity and Innovation Drags | Debt that blocks hiring ramp-up, slows onboarding, or prevents adopting new AI frameworks/tools. |
| Cost leakage | Excessive cloud spend from inefficient pipelines or recompute due to unmonitored model decay. |
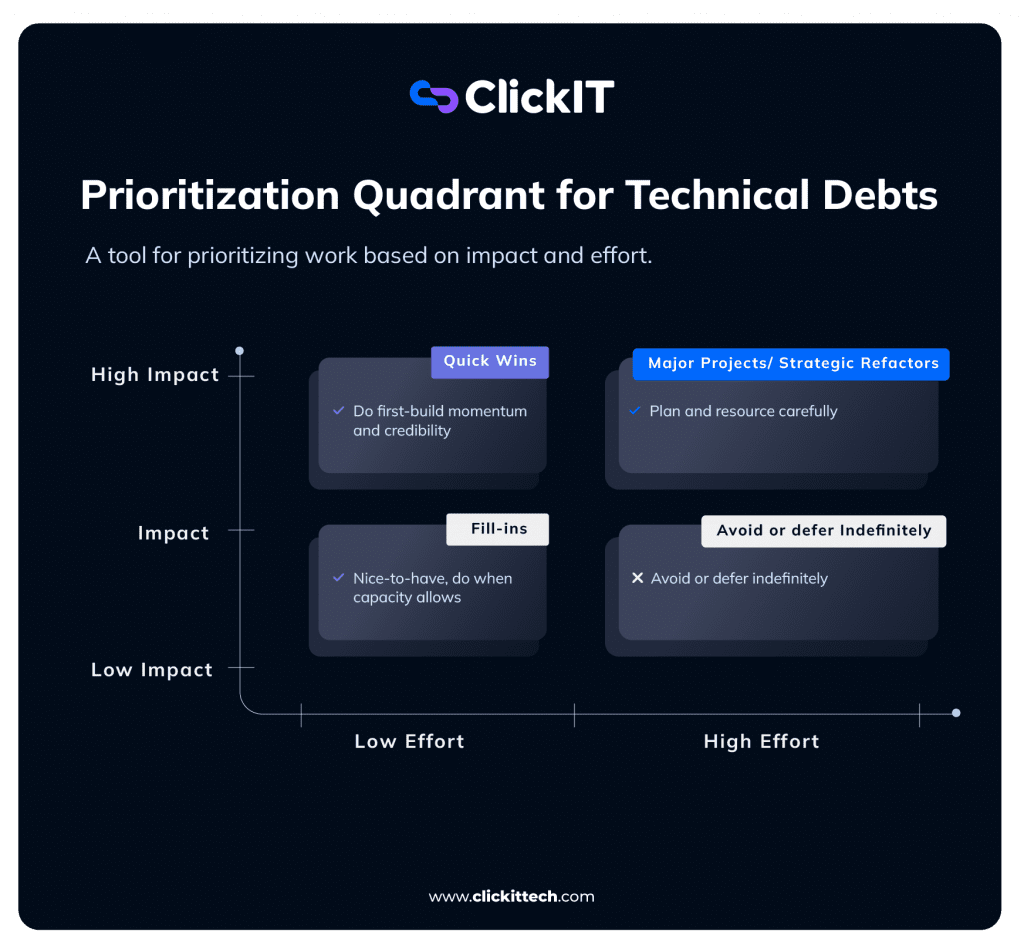
Quick Wins vs Strategic Refactors
Not all technical debt fixes are equal. The best thing is to balance short-term wins with long-term structural improvements.
| Technical Debt Reduction Strategies | Examples | Benefits |
| Quick Wins (High Value, Low Effort) Quick wins build momentum and demonstrate ROI quickly. | Removing dead code that is causing confusionPatching critical security vulnerabilitiesUpgrading low-risk dependenciesFixing a high-churn module that’s blocking frequent deployments.Adding monitoring to a decaying ML modelAutomating manual deployment stepsIncreasing test coverage in critical flows | Improves stability quicklyBoosts team moraleShows visible progress to stakeholdersFrees engineering time faster |
| Strategic Refactors (High Value, Higher Effort) These address foundational issues that block scalability or innovation. | Breaking monoliths into modular servicesRebuilding core data modelsReplacing legacy integration layersMigrating to modern cloud-native architectures | Enables future feature velocityReduces long-term operational costSupports AI, analytics, and automation initiativesImproves long-term reliability |
Smart technical debt reduction programs usually maintain a mix like:
- 30–40% Quick Wins
- 60–70% Strategic Improvements (spread across quarters)
As a best practice:
- Quickwins: Target 2–4 quick wins per quarter to show measurable improvement.
For eg. 20% drop in incidents, faster lead time
- Strategic refactors:
- Break them into incremental milestones. For eg. strangler fig pattern
- Allocate dedicated capacity. For eg. 1–2 quarters of focused work.
- Pair with business milestones. For eg. Before next major product launch
Here is a visualization of the classic Impact-Effort Matrix, often called the prioritization quadrant:
Many teams adapt product prioritization frameworks like RICE or Cost of Delay to score debt items:
- RICE (Reach × Impact × Confidence / Effort)
- Cost of Delay (Urgency × Value lost per time unit)
Example simple scoring (scale 1–10):
- Business Impact (revenue, reliability, security, CX, velocity drag)
- Urgency / Cost of Delay (how fast the problem worsens)
- Effort (story points or engineer-weeks)
- Confidence (how sure are we of the estimates?)
Total score = (Impact × Urgency × Confidence) / Effort
Higher Score implies Higher Priority
Avoid the “Fix Everything” Trap
While it is tempting to eliminate all technical debt at once, it is one of the fastest ways to fail. This approach stalls the product roadmap and burns out engineers while making stakeholders lose confidence. The worst thing is that new debt accumulates anyway, making the ROI unclear.
So, our goal is to have controlled, intentional debt. Not zero debt.
As a best practice:
- Allocate fixed capacity (10–20% per sprint/quarter) rather than chasing perfection.
- Review and reprioritize the debt backlog quarterly.
- Celebrate the success publicly. Share metrics like reduced incidents or faster delivery after fixes.
- Involve cross-functional stakeholders (product, finance, risk) in prioritization sessions to align on business value.
What are the Strategies to Reduce Technical Debt?
a) Make Debt Reduction Part of Normal Development
Reducing technical debt is not a one-time cleanup project. For a sustainable technical debt reduction, treat debt management as a continuous discipline embedded in delivery, architecture, and platform strategy.
- Allocate a Fixed Percentage of Engineering Capacity: Reserve 10–30% of sprint capacity for technical debt reduction. This prevents debt from compounding silently. It also reduces massive future refactor projects and constant firefighting cycles.
This capacity can be used for:
- Refactoring high-risk modules
- Improving test coverage
- Upgrading dependencies
- Reducing complexity in critical flows
- Improving observability
Even a 10% capacity applied continuously can dramatically reduce long-term technical debt.
- Define “Done” to Prevent New Debt: Technical debt reduction is impossible if new debt is constantly introduced.
So, define “Done” to include:
- Code reviewed and meets standards
- Automated tests added for critical paths
- Security checks completed
- Documentation updated where needed
- Monitoring and logging are included
This ensures teams are not trading speed today for risk tomorrow.
- Track Technical Debt Visibly in Backlogs and Planning: Technical debt should not live in hidden engineering notes. It must be visible in sprint planning discussions, quarterly roadmap planning, engineering dashboards, and leadership reviews.
As a best practice, tag debt items with business impact labels like:
- Revenue Risk
- Reliability Risk
- Security Risk
- Scalability Risk
This helps non-technical stakeholders understand why debt work matters.
Free your engineers from the maintenance trap. Our AI teams integrate with yours to handle strategic refactoring while you focus on high-impact features. Book a Call
b) Refactor Incrementally (Don’t Rewrite Everything)
One of the biggest mistakes leaders make when deciding how to reduce technical debt is approving full system rewrites. Most rewrites take longer than expected, deliver value late, and also introduce new bugs. Moreover, the domain knowledge embedded in existing systems is lost.
- Promote Small, Continuous Improvements: This incremental refactoring spreads risk and cost over time.
Examples:
- Refactor modules when adding new features.
- Replace legacy components service by service.
- Improve data models gradually.
- Introduce new APIs while deprecating old ones.
This approach allows teams to improve systems without stopping delivery.
- When Incremental Refactoring Beats Full Rewrites:
| Incremental wins when: | Full Rewrites make sense when: |
| The system is still delivering business valueDomain logic is complex and well understoodThe risk of full rewrite failure is highCustomer disruption risk is high | The platform is blocking the core business strategyTechnology is no longer supportedSecurity or compliance risk is extremeArchitecture cannot scale at all |
- Address Architecture and Infrastructure Debt (Not Just Code): Many organizations focus only on code quality, but architecture and platform debt often have a bigger business impact.
Examples to address:
- Poor service boundaries
- Overloaded shared databases
- Manual infrastructure provisioning
- Lack of observability and monitoring
- Poor environmental parity
Ignoring platform debt often results in repeated incidents and scaling limits.
c) Use Automation and Modern Tools
Automation is one of the fastest ways to reduce technical debt sustainably. The benefits include safer refactoring, faster deployments, lower incident rates, and reduced operational overhead.
- Role of Testing, CI/CD, and Infrastructure Automation: Automation in these areas helps reduce manual risk and improve consistency.
Build a robust pipeline with quality gates:
- Unit/integration/E2E tests
- Static analysis (SonarQube)
- Security scans (Snyk, Trivy)
- Dependency updates (Dependabot/Renovate)
- IaC linting and drift detection
- How AI Tools Can Help Reduce Technical Debt or Worsen it if Misused?
AI is rapidly changing technical debt management. Tools like GitHub Copilot, Cursor, Claude Code, or Amazon Q accelerate refactoring. They suggest cleaner patterns, generate tests, explain legacy code, and migrate syntax.
Here are key areas AI shines:
- Code analysis and complexity detection
- Automated test generation
- Documentation generation
- Refactoring suggestions
- Legacy code explanation
If teams blindly accept AI-generated code, new debt can be introduced through:
- Inconsistent patterns
- Poor architectural decisions
- Hidden security risks
- Over-engineered solutions
- Duplicate logic
It is recommended to treat AI as a junior pair programmer, not an architect.
- Use Platforms and Managed Services to Reduce Maintenance Debt: Moving to managed services reduces operational technical debt.
For instance, you can use managed databases instead of self-hosted and observability platforms instead of custom monitoring stacks. Similarly, managed identity and security platforms and serverless compute help you with event-driven workloads.
d) Prevent Future Debt With Governance
The most cost-effective technical debt reduction strategy is preventing new debt. Here are key ways to do so.
- Coding Standards and Code Reviews: Consistent coding standards reduce long-term maintainability issues. Enforce them via tools like Prettier, ESLint/Black/Ruff, .editorconfig. During code reviews, check for readability, test coverage, and debt introduction. You can use checklists or bots.
As a best practice, implement standardized project structures, approved dependency lists, mandatory peer code reviews, and static analysis enforcement, etc.
- Lightweight Architecture Governance: Heavy architecture boards slow delivery. Modern teams use lightweight governance. Use Architecture Decision Records (ADRs) for major choices and hold lightweight quarterly architecture reviews.
When it comes to AI, enforce experiment tracking, model registries, and evaluation standards. This prevents fragmentation without blocking innovation.
- Documentation, Training, and Reducing Knowledge Silos: Knowledge debt is real technical debt. Prevent it through living documentation, onboarding guides, internal tech talks, and rotating ownership models. Systems that only one engineer understands pose a long-term risk. So, Cross-team knowledge sharing and internal tech talks would be a great help here.
Why Technical Debt Is a People Problem?
In most discussions about how to prevent technical debt, the conversation usually starts with code quality, architecture, or tooling. But in reality, technical debt is rarely created purely by technology decisions. It is created and sustained by organizational behavior, incentives, and communication gaps.
Most technical debt exists because teams were optimizing for something else at that time. It may be speed to market, cost reduction, regulatory deadlines, or competitive pressure. That makes technical debt fundamentally a people and decision-making problem, not just an engineering one.
Organizations that succeed in long-term technical debt reduction usually don’t just invest in tools or refactoring projects. They build cultures where technical debt is visible, discussed openly, and managed intentionally.
Here are the four cultural pillars that help you keep debt under control even as they scale rapidly:
a) Leadership Buy-In and Executive Communication
Technical debt reduction mostly fails when there is no visible executive support. If leadership messaging consistently emphasizes feature delivery over system health, teams will naturally deprioritize debt, even when they know it is risky.
It is important to treat technical debt as a strategic business risk, similar to security exposure or operational downtime. Leaders should regularly reinforce that engineering quality is directly tied to customer trust, reliability, and long-term growth.
Executives should consistently ask questions like:
- “What technical risks are building up?”
- “What debt is slowing our roadmap?”
- “What debt could impact customers or revenue next year?”
This approach drives in a message that technical health is part of business strategy, not just engineering preference.
b) Translating Technical Debt Into Business Language
One of the biggest barriers to reducing technical debt is communication. Engineering teams often describe debt in technical terms like complexity, coupling, and legacy frameworks. On the other hand, business leaders think in terms of revenue, risk, and customer outcomes.
The organizations that make real progress on technical debt reduction strategies are those that translate technical issues into business impact.
For example, instead of saying:
“This service has high cyclomatic complexity.”
Teams communicate:
“This service is slowing new feature launches and increasing outage risk during peak traffic.”
This shift changes technical debt from a cost center discussion into a risk management and investment discussion. It also makes it much easier to secure budget and roadmap space for debt reduction work.
Here are a few more examples of technical descriptions translated into business language:
| Technical Description | Business Translation |
| Model performance decay without monitoring | “Our recommendation model loses 0.8% accuracy per month; without retraining we’re projected to lose Y% of conversion lift in Q3.” |
| Monolith entanglement blocking parallel work | “Teams are blocked 40% of the time waiting for the same service, slowing new feature delivery by Z weeks per quarter.” |
| Outdated dependency with a known CVE | “This vulnerability exposes us to potential breach with regulatory fines up to $A million and brand damage.” |
| Zero automated tests in the critical path | “Every change requires 3–5 days of manual regression, inflating lead time and increasing human error risk.” |
c) Creating psychological safety so teams surface debt early
In many organizations, technical debt grows silently because engineers hesitate to raise concerns. This is because teams fear being blamed for past design decisions or feel pressure to prioritize delivery at all costs.
A healthy engineering culture encourages teams to surface technical debt early before it becomes expensive or dangerous.
For instance, leaders should feel safe to say:
- “I approved this shortcut in 2023 to hit launch; it cost us 9 months of velocity later. Let us not repeat it.”
- “I don’t fully understand this part of the system. Can someone walk me through why it is this way?”
Engineers should feel safe to say:
- “This shortcut will create risk in six months.”
- “We should allocate time to fix this before scaling.”
- “We need to redesign this before adding new features.”
Similarly, using blameless language works well. Instead of asking, “ Who broke this?, you can say, “ What caused this break and how can we prevent it next time?”.
This is when the organization dramatically improves its ability to prevent technical debt instead of constantly reacting to it.
Postmortems, retrospectives, and architecture reviews should focus on learning and system improvement, not blame. When teams trust that raising debt issues will be rewarded rather than punished, visibility improves significantly.
d) Reinforcing Continuous Improvement as a Cultural Value
To be effective, organizations should treat technical debt reduction as part of their identity, not as a temporary initiative. Instead of occasional “cleanup quarters,” technical debt can be addressed in small, consistent increments. Over time, this dramatically reduces risk while preserving delivery speed.
Considering the Boy Scout Rule, praise engineers who cleaned small messes while delivering features.
Continuous improvement cultures normalize:
- Small refactoring during feature work
- Regular architecture evolution
- Ongoing automation improvements
- Continuous learning and skill development
This mindset is especially important in AI-driven and fast-scaling environments, where systems evolve rapidly and complexity grows faster, compared to traditional software models.
How to Measure Success in Technical Debt Strategies?
When you start investing in technical debt reduction, a new challenge emerges. How do you know it’s working and how do you keep it working?
Many technical debt initiatives fail not because the strategy was wrong, but because success was never clearly defined. Teams fix issues, refactor systems, and improve tooling, but the leadership struggles to see measurable progress. Over time, priorities shift back to pure feature delivery, and debt quietly starts accumulating again.
If leaders want to truly master how to reduce technical debt, they must treat measurement and visibility as core parts of the strategy and not as afterthoughts.
a) Define Success Metrics (Technical + Business)
Technical debt success cannot be measured using engineering metrics alone. The most effective way is to combine technical health signals with business outcome indicators.
On the technical side, teams often see faster lead times for changes, fewer production incidents, lower change failure rates, and improved test coverage in critical systems. Systems become easier to modify, releases become less stressful, and incident recovery becomes faster.
On the other side, leadership ultimately cares about business impact. When technical debt reduction is working, organizations often see faster time-to-market for new features, improved system availability for customer-facing services, and lower operational firefighting costs. In some cases, teams also see better developer retention because engineers spend more time building new capabilities instead of patching fragile systems.
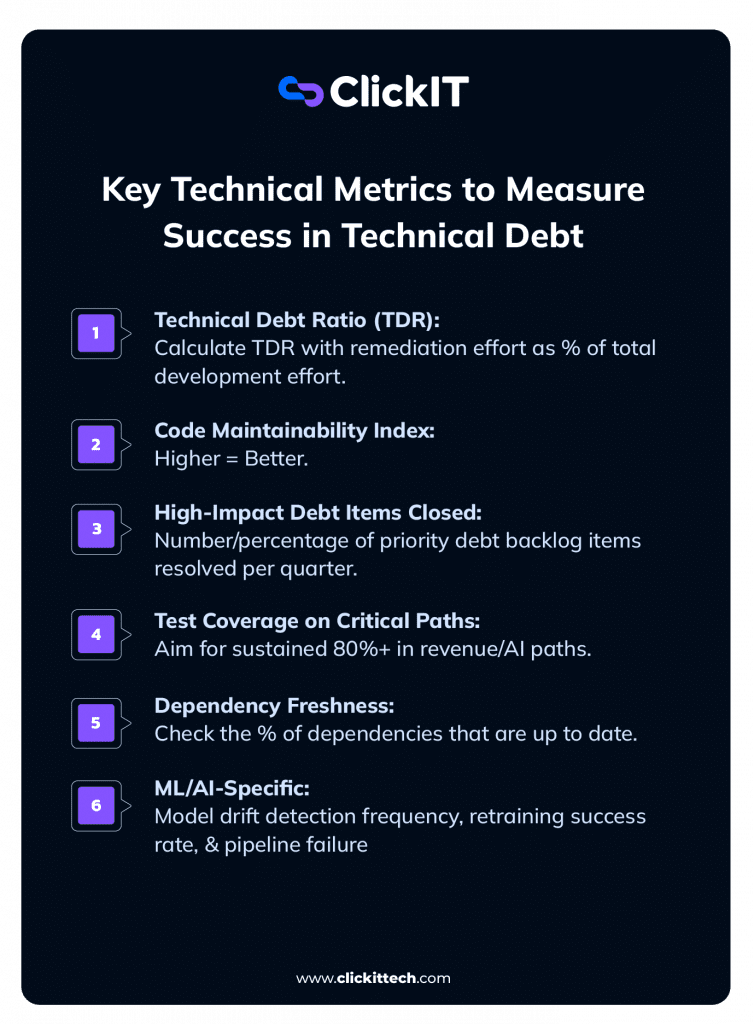
Key Technical Metrics (System Health)
- Technical Debt Ratio (TDR): Calculate TDR with remediation effort as % of total development effort (Target: <5–10%; Track quarterly reduction).
- Code Maintainability Index: Use tools like SonarQube/CodeClimate (Higher = Better).
- High-Impact Debt Items Closed: Number/percentage of priority debt backlog items resolved per quarter
- Test Coverage on Critical Paths: Aim for sustained 80%+ in revenue/AI paths.
- Dependency Freshness: Check for % of dependencies up-to-date or within the support window.
- ML/AI-Specific: Check out for model drift detection frequency, retraining success rate, pipeline failure rate reduction.
Key Business Metrics (Value Delivered)
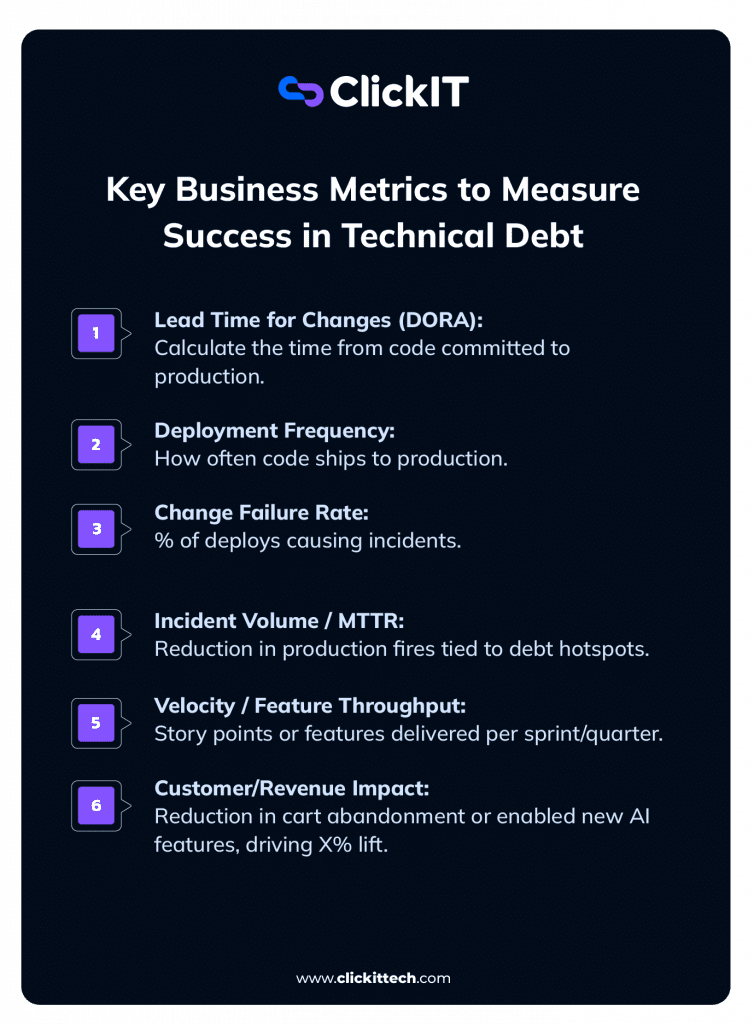
- Lead Time for Changes (DORA): Calculate the time from code committed to production (Shorter = Less debt drag).
- Deployment Frequency: Check out how often code ships to production.
- Change Failure Rate: % of deploys causing incidents (Lower = Healthier system)
- Incident Volume / MTTR: Reduction in production fires tied to debt hotspots
- Velocity / Feature Throughput: Story points or features delivered per sprint/quarter (Upward trend post-debt work)
- Customer/Revenue Impact: e.g., Reduction in cart abandonment due to faster performance, or enabled new AI features driving X% lift
- Engineer Satisfaction: eNPS or survey scores on “Ease of working in the codebase.”
The most important shift is that success is not measured by how much code was cleaned. It is measured by how much risk, cost, and delivery friction were removed.
b) Use Dashboards and Transparency to Guide Decisions
Technical debt becomes manageable when it becomes visible. This is where dashboards come in handy. They translate complex engineering signals into trends that leadership can track over time.
For example:
- Central Dashboard using Grafana, Datadog, Stepsize AI, or custom in Looker/Tableau showing trends over time
- Embed in OKR reviews, sprint planning, and all-hands
- Service-level health cards (e.g., via Backstage/Compass) with debt indicators per microservice or ML pipeline
- Automated alerts when TDR rises or coverage drops below thresholds
- Quarterly “Tech Health Report” shared company-wide: wins, risks, next focus areas
As a best practice, maintain shared dashboards that show a combination of delivery metrics, reliability indicators, and technical quality trends. This allows engineering leaders, product leaders, and executives to look at the same data when making roadmap decisions.
Transparency changes behavior. When teams can clearly see how technical debt affects incident rates, delivery speed, or customer-facing reliability, it becomes easier to justify ongoing investment in debt reduction. It also helps prevent sudden shifts away from technical health work during high-pressure product cycles.
The goal is not to create dozens of dashboards. The goal is to create a single, trusted view of system health and delivery performance that is reviewed regularly at leadership and team levels.
c) Zero Technical Debt Is Not the Goal – Sustainability Is
One of the most dangerous misconceptions in technical leadership is the idea that technical debt can be eliminated completely. In reality, technical debt is a natural byproduct of building software under real-world constraints.
Every product launch, architectural shortcut, or integration decision carries some form of trade-off. Trying to eliminate all technical debt usually leads to stalled product development and frustrated teams.
So, focus on sustainable technical debt levels. This means:
- Debt is visible and tracked.
- High-risk debt is addressed quickly.
- Low-risk debt is consciously accepted.
- New debt is introduced intentionally and documented.
This mindset turns technical debt into a managed strategic tool rather than an uncontrolled liability.
d) Treat Technical Debt as Ongoing Maintenance, Not a One-Time Cleanup
Technical debt reduction is most successful when it is treated like system maintenance rather than a transformation project.
Organizations that run large “debt cleanup initiatives” often see temporary improvement followed by regression. The reason is simple. If development processes don’t change, new debt replaces old debt quickly.
So, build technical debt management into daily engineering workflows so that refactoring can happen during feature development. Architecture evolves gradually. Infrastructure is continuously modernized and automation expands incrementally.
Over time, this creates a compounding effect. Systems become easier to change, teams become faster, and reliability improves without requiring massive, disruptive refactoring programs.

Why Treat Technical Debt as a Strategic Investment?
For many organizations, technical debt is a cost center. It is something to clean up only when systems start failing or delivery slows down. But the most forward-looking tech leaders treat technical debt reduction not as maintenance work, but as a strategic investment in the company’s future.
Leaders who really want to master how to reduce technical debt must move the conversation from “cleanup work” to business future-proofing.
a) Reframing Technical Debt Reduction as Business Future-Proofing
Every organization today is operating in an environment of constant technological change. AI adoption, cloud evolution, cybersecurity threats, regulatory shifts, and rising customer expectations all demand systems that can adapt quickly.
Technical debt directly limits that adaptability.
When systems are fragile, tightly coupled, or difficult to modify, every strategic initiative becomes slower and riskier. Launching new products takes longer, and integrating AI capabilities becomes harder, while security patches take longer to deploy. As innovation cycles stretch out, scaling into new markets becomes more expensive.
In contrast, organizations that consistently invest in technical debt reduction strategies create platforms that can evolve alongside business strategy. Instead of reacting to technology shifts, they can proactively take advantage of them.
This is why technical debt reduction is better framed as risk reduction + opportunity creation, not just cost control.
The Long-Term Payoff: Speed, Resilience, and Innovation
The real value of reducing technical debt rarely shows up as a single visible event. Instead, it shows up as a compounding operational advantage over time.
When technical debt is actively managed, engineering teams move faster as they spend less time debugging legacy behavior or navigating fragile dependencies. New features can be shipped with greater confidence and release cycles become predictable. Teams spend more time building differentiating capabilities rather than maintaining old systems.
Resilience also improves. Systems become more stable because they are easier to observe, test, and recover. Incident frequency drops and recovery time improves. Customer trust increases because reliability becomes consistent, not reactive.
Innovation accelerates as well. When core platforms are clean, modular, and well-documented, organizations can experiment safely. They can integrate new AI models, launch new services, or enter new markets without massive replatforming projects.
Over time, these advantages compound. Organizations that consistently invest in reducing technical debt tend to ship faster, operate more reliably, and adapt to market change more easily than competitors who delay debt reduction until crises occur.
The Competitive Advantage of Intentional Technical Debt Management
Every organization carries technical debt. The difference is whether that debt is intentional and controlled or accidental and growing.
Intentional technical debt means teams consciously make trade-offs, document them, and plan when to address them. Accidental technical debt happens when shortcuts are taken without visibility, tracking, or long-term planning.
The organizations that treat technical debt as a strategic investment are usually the ones that:
- Make faster platform transitions.
- Adopt new technologies earlier.
- Scale engineering teams more easily.
- Maintain more predictable delivery timelines.
- Recover from incidents faster.
- Maintain stronger customer trust.
This becomes a long-term competitive advantage that is difficult for competitors to replicate quickly.
Frequently Asked Questions (FAQs)
Some debt is inevitable and even strategic, especially in fast-moving environments like AI startups or scale-ups. The key metric is your Technical Debt Ratio (TDR). Aim to keep it under 5–10% long-term (remediation effort as a percentage of total dev effort). Above 15–20% often signals serious velocity drag, higher incidents, and talent risk.
Acceptable debt includes deliberate shortcuts for market validation. For example, a quick MVP prototype with a clear repayment plan.
Yes, as per Google Seminal paper, AI systems amplify debt because only 5–10% is model code. The rest is data pipelines, features, configs, and monitoring. This hidden debt causes model decay, drift, recompute waste, and untrustworthy outputs.
As such, teams have to deal with silent performance erosion even without code changes, entangled features, and prompt/tool sprawl in GenAI.
In customer-facing systems, technical debt that directly impacts reliability, performance, and data accuracy should be addressed first. This includes issues causing downtime, slow response times in core user journeys, inconsistent customer data, and security vulnerabilities. Debt affecting revenue flows like checkout, billing, or onboarding should typically be treated as the highest priority.